Chippewa vs Dutch Divorced or Separated
COMPARE
Chippewa
Dutch
Divorced or Separated
Divorced or Separated Comparison
Chippewa
Dutch
13.2%
DIVORCED OR SEPARATED
0.0/ 100
METRIC RATING
305th/ 347
METRIC RANK
12.4%
DIVORCED OR SEPARATED
3.1/ 100
METRIC RATING
242nd/ 347
METRIC RANK
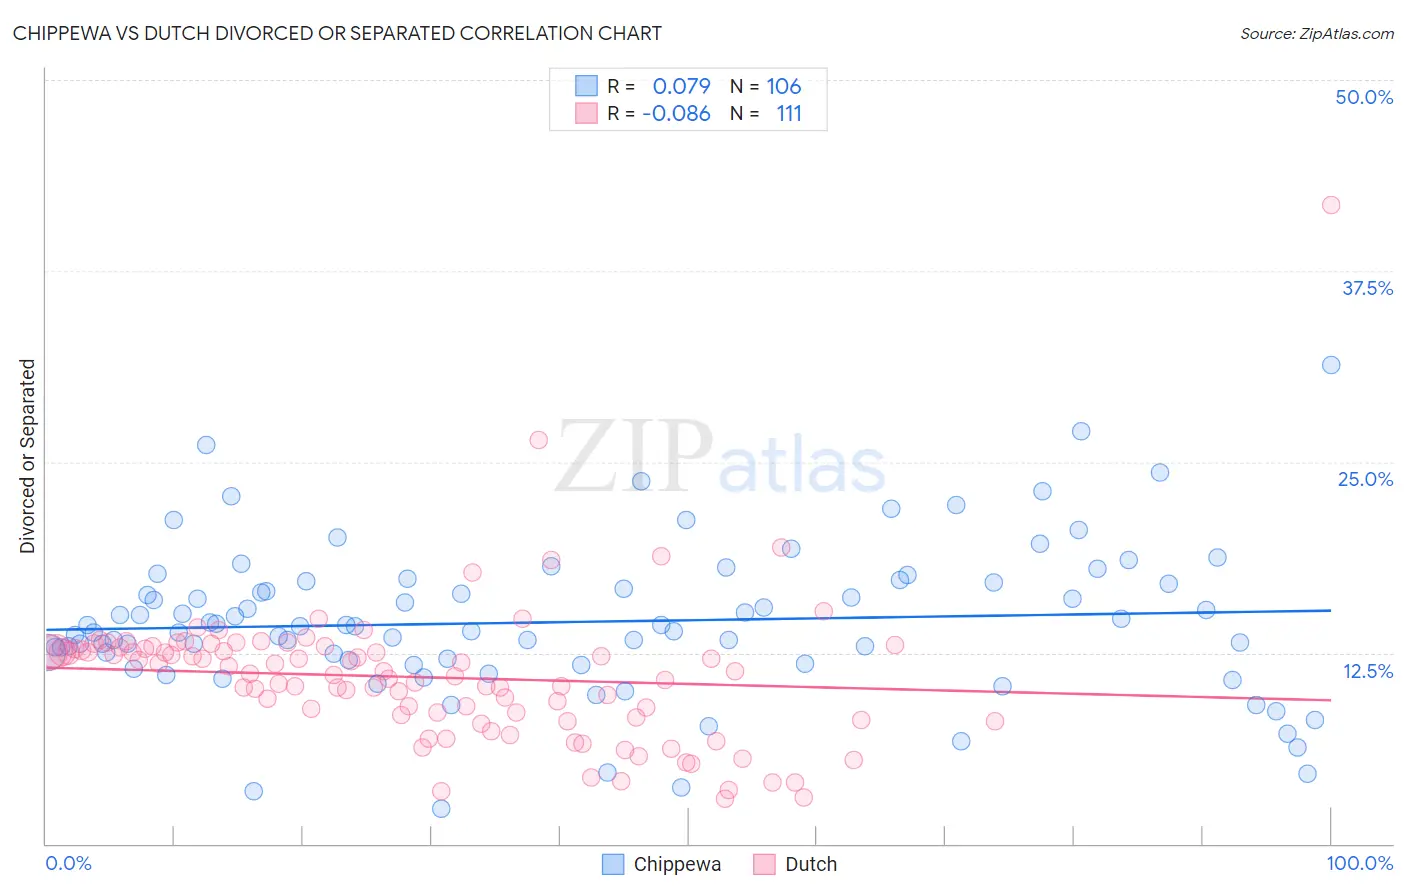
Chippewa vs Dutch Divorced or Separated Correlation Chart
The statistical analysis conducted on geographies consisting of 215,036,643 people shows a slight positive correlation between the proportion of Chippewa and percentage of population currently divorced or separated in the United States with a correlation coefficient (R) of 0.079 and weighted average of 13.2%. Similarly, the statistical analysis conducted on geographies consisting of 553,980,787 people shows a slight negative correlation between the proportion of Dutch and percentage of population currently divorced or separated in the United States with a correlation coefficient (R) of -0.086 and weighted average of 12.4%, a difference of 6.0%.
Divorced or Separated Correlation Summary
| Measurement | Chippewa | Dutch |
| Minimum | 2.3% | 3.0% |
| Maximum | 31.3% | 41.8% |
| Range | 29.0% | 38.9% |
| Mean | 14.5% | 10.9% |
| Median | 14.2% | 11.1% |
| Interquartile 25% (IQ1) | 12.0% | 8.3% |
| Interquartile 75% (IQ3) | 17.1% | 12.8% |
| Interquartile Range (IQR) | 5.1% | 4.5% |
| Standard Deviation (Sample) | 4.9% | 4.7% |
| Standard Deviation (Population) | 4.9% | 4.7% |
Similar Demographics by Divorced or Separated
Demographics Similar to Chippewa by Divorced or Separated
In terms of divorced or separated, the demographic groups most similar to Chippewa are Hopi (13.2%, a difference of 0.050%), Tlingit-Haida (13.2%, a difference of 0.16%), Cape Verdean (13.1%, a difference of 0.18%), Immigrants from Venezuela (13.1%, a difference of 0.20%), and Alaskan Athabascan (13.1%, a difference of 0.30%).
| Demographics | Rating | Rank | Divorced or Separated |
| Venezuelans | 0.0 /100 | #298 | Tragic 13.0% |
| Immigrants | Jamaica | 0.0 /100 | #299 | Tragic 13.0% |
| Immigrants | Cabo Verde | 0.0 /100 | #300 | Tragic 13.1% |
| Alaskan Athabascans | 0.0 /100 | #301 | Tragic 13.1% |
| Immigrants | Venezuela | 0.0 /100 | #302 | Tragic 13.1% |
| Cape Verdeans | 0.0 /100 | #303 | Tragic 13.1% |
| Hopi | 0.0 /100 | #304 | Tragic 13.2% |
| Chippewa | 0.0 /100 | #305 | Tragic 13.2% |
| Tlingit-Haida | 0.0 /100 | #306 | Tragic 13.2% |
| French American Indians | 0.0 /100 | #307 | Tragic 13.2% |
| Ottawa | 0.0 /100 | #308 | Tragic 13.2% |
| Americans | 0.0 /100 | #309 | Tragic 13.2% |
| Africans | 0.0 /100 | #310 | Tragic 13.2% |
| Sioux | 0.0 /100 | #311 | Tragic 13.2% |
| Blackfeet | 0.0 /100 | #312 | Tragic 13.3% |
Demographics Similar to Dutch by Divorced or Separated
In terms of divorced or separated, the demographic groups most similar to Dutch are Immigrants from Latin America (12.4%, a difference of 0.070%), Uruguayan (12.4%, a difference of 0.090%), British West Indian (12.4%, a difference of 0.17%), Alaska Native (12.4%, a difference of 0.17%), and Immigrants from Germany (12.4%, a difference of 0.23%).
| Demographics | Rating | Rank | Divorced or Separated |
| Immigrants | Bosnia and Herzegovina | 4.3 /100 | #235 | Tragic 12.4% |
| Colombians | 4.2 /100 | #236 | Tragic 12.4% |
| Immigrants | Laos | 4.2 /100 | #237 | Tragic 12.4% |
| Sudanese | 4.0 /100 | #238 | Tragic 12.4% |
| Immigrants | Germany | 4.0 /100 | #239 | Tragic 12.4% |
| British West Indians | 3.7 /100 | #240 | Tragic 12.4% |
| Uruguayans | 3.4 /100 | #241 | Tragic 12.4% |
| Dutch | 3.1 /100 | #242 | Tragic 12.4% |
| Immigrants | Latin America | 2.8 /100 | #243 | Tragic 12.4% |
| Alaska Natives | 2.5 /100 | #244 | Tragic 12.4% |
| Hispanics or Latinos | 2.0 /100 | #245 | Tragic 12.5% |
| Immigrants | West Indies | 1.9 /100 | #246 | Tragic 12.5% |
| Germans | 1.8 /100 | #247 | Tragic 12.5% |
| Nepalese | 1.8 /100 | #248 | Tragic 12.5% |
| Finns | 1.8 /100 | #249 | Tragic 12.5% |