Liberian vs Immigrants from Mexico Currently Married
COMPARE
Liberian
Immigrants from Mexico
Currently Married
Currently Married Comparison
Liberians
Immigrants from Mexico
42.2%
CURRENTLY MARRIED
0.0/ 100
METRIC RATING
299th/ 347
METRIC RANK
44.5%
CURRENTLY MARRIED
0.7/ 100
METRIC RATING
239th/ 347
METRIC RANK
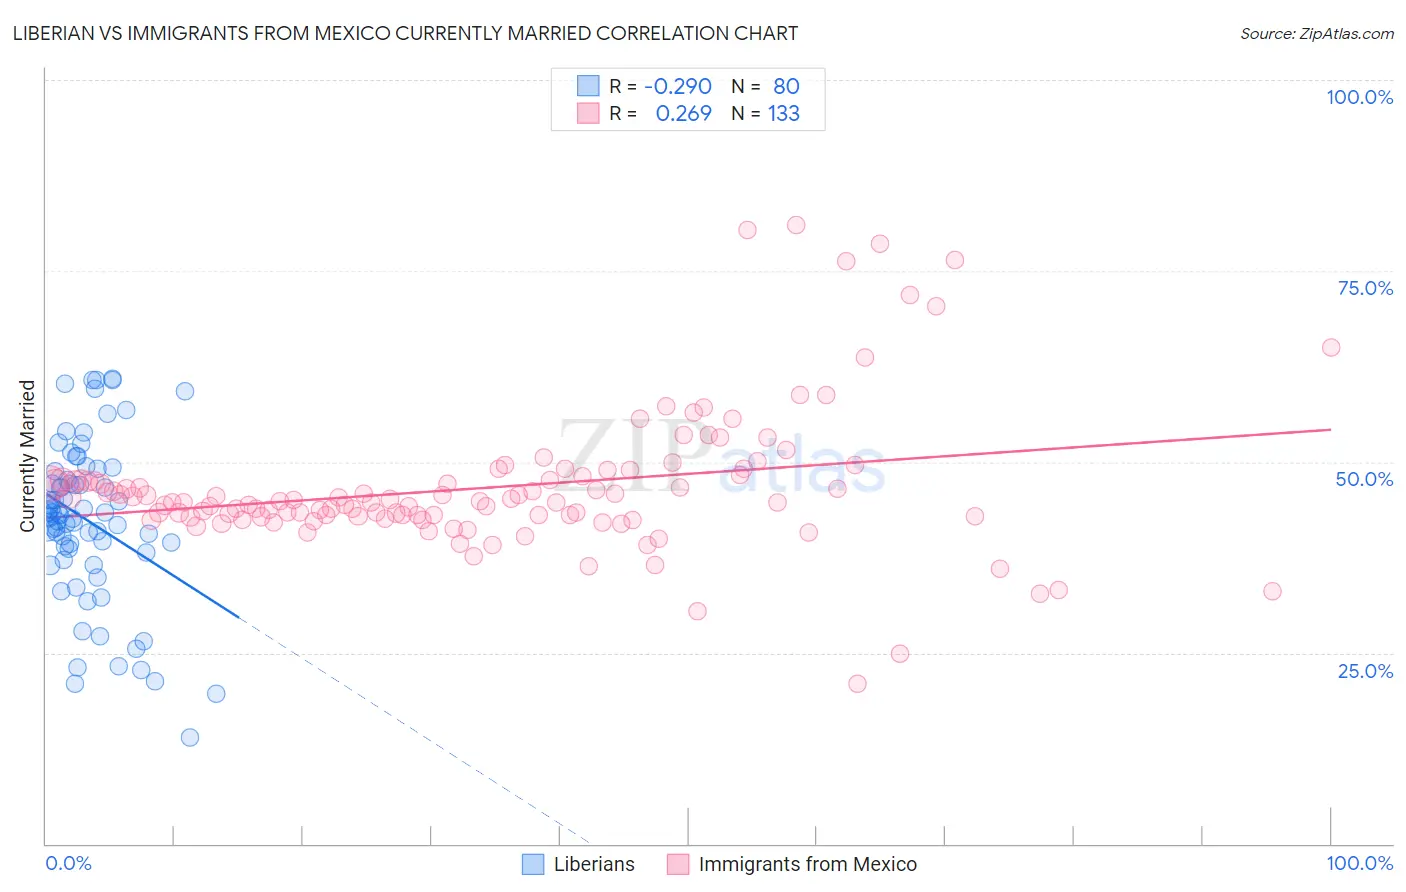
Liberian vs Immigrants from Mexico Currently Married Correlation Chart
The statistical analysis conducted on geographies consisting of 118,089,521 people shows a weak negative correlation between the proportion of Liberians and percentage of population currently married in the United States with a correlation coefficient (R) of -0.290 and weighted average of 42.2%. Similarly, the statistical analysis conducted on geographies consisting of 513,698,196 people shows a weak positive correlation between the proportion of Immigrants from Mexico and percentage of population currently married in the United States with a correlation coefficient (R) of 0.269 and weighted average of 44.5%, a difference of 5.6%.
Currently Married Correlation Summary
| Measurement | Liberian | Immigrants from Mexico |
| Minimum | 13.9% | 20.9% |
| Maximum | 60.9% | 81.0% |
| Range | 47.0% | 60.1% |
| Mean | 42.3% | 46.6% |
| Median | 42.9% | 44.8% |
| Interquartile 25% (IQ1) | 38.4% | 42.8% |
| Interquartile 75% (IQ3) | 48.1% | 47.9% |
| Interquartile Range (IQR) | 9.7% | 5.1% |
| Standard Deviation (Sample) | 10.5% | 9.3% |
| Standard Deviation (Population) | 10.4% | 9.2% |
Similar Demographics by Currently Married
Demographics Similar to Liberians by Currently Married
In terms of currently married, the demographic groups most similar to Liberians are Immigrants from Honduras (42.2%, a difference of 0.030%), Belizean (42.2%, a difference of 0.10%), Cheyenne (42.2%, a difference of 0.12%), Menominee (42.3%, a difference of 0.23%), and Immigrants from Yemen (42.1%, a difference of 0.34%).
| Demographics | Rating | Rank | Currently Married |
| Sub-Saharan Africans | 0.0 /100 | #292 | Tragic 42.6% |
| Yuman | 0.0 /100 | #293 | Tragic 42.6% |
| Hondurans | 0.0 /100 | #294 | Tragic 42.5% |
| Immigrants | Western Africa | 0.0 /100 | #295 | Tragic 42.4% |
| Menominee | 0.0 /100 | #296 | Tragic 42.3% |
| Cheyenne | 0.0 /100 | #297 | Tragic 42.2% |
| Immigrants | Honduras | 0.0 /100 | #298 | Tragic 42.2% |
| Liberians | 0.0 /100 | #299 | Tragic 42.2% |
| Belizeans | 0.0 /100 | #300 | Tragic 42.2% |
| Immigrants | Yemen | 0.0 /100 | #301 | Tragic 42.1% |
| Immigrants | Zaire | 0.0 /100 | #302 | Tragic 42.0% |
| Sioux | 0.0 /100 | #303 | Tragic 41.9% |
| Immigrants | Bahamas | 0.0 /100 | #304 | Tragic 41.9% |
| Immigrants | Trinidad and Tobago | 0.0 /100 | #305 | Tragic 41.9% |
| Immigrants | Guyana | 0.0 /100 | #306 | Tragic 41.9% |
Demographics Similar to Immigrants from Mexico by Currently Married
In terms of currently married, the demographic groups most similar to Immigrants from Mexico are Mexican American Indian (44.5%, a difference of 0.0%), Ethiopian (44.5%, a difference of 0.060%), Immigrants from Cambodia (44.5%, a difference of 0.090%), Immigrants from Ethiopia (44.5%, a difference of 0.10%), and Moroccan (44.6%, a difference of 0.14%).
| Demographics | Rating | Rank | Currently Married |
| Nepalese | 1.2 /100 | #232 | Tragic 44.7% |
| Immigrants | Saudi Arabia | 1.1 /100 | #233 | Tragic 44.7% |
| Iroquois | 1.1 /100 | #234 | Tragic 44.7% |
| Alaskan Athabascans | 0.9 /100 | #235 | Tragic 44.6% |
| Cubans | 0.9 /100 | #236 | Tragic 44.6% |
| Seminole | 0.9 /100 | #237 | Tragic 44.6% |
| Moroccans | 0.9 /100 | #238 | Tragic 44.6% |
| Immigrants | Mexico | 0.7 /100 | #239 | Tragic 44.5% |
| Mexican American Indians | 0.7 /100 | #240 | Tragic 44.5% |
| Ethiopians | 0.7 /100 | #241 | Tragic 44.5% |
| Immigrants | Cambodia | 0.7 /100 | #242 | Tragic 44.5% |
| Immigrants | Ethiopia | 0.7 /100 | #243 | Tragic 44.5% |
| Japanese | 0.6 /100 | #244 | Tragic 44.5% |
| Immigrants | Armenia | 0.4 /100 | #245 | Tragic 44.3% |
| Immigrants | Burma/Myanmar | 0.4 /100 | #246 | Tragic 44.3% |