Cherokee vs Immigrants from Taiwan Single Father Households
COMPARE
Cherokee
Immigrants from Taiwan
Single Father Households
Single Father Households Comparison
Cherokee
Immigrants from Taiwan
2.6%
SINGLE FATHER HOUSEHOLDS
0.1/ 100
METRIC RATING
278th/ 347
METRIC RANK
1.8%
SINGLE FATHER HOUSEHOLDS
100.0/ 100
METRIC RATING
6th/ 347
METRIC RANK
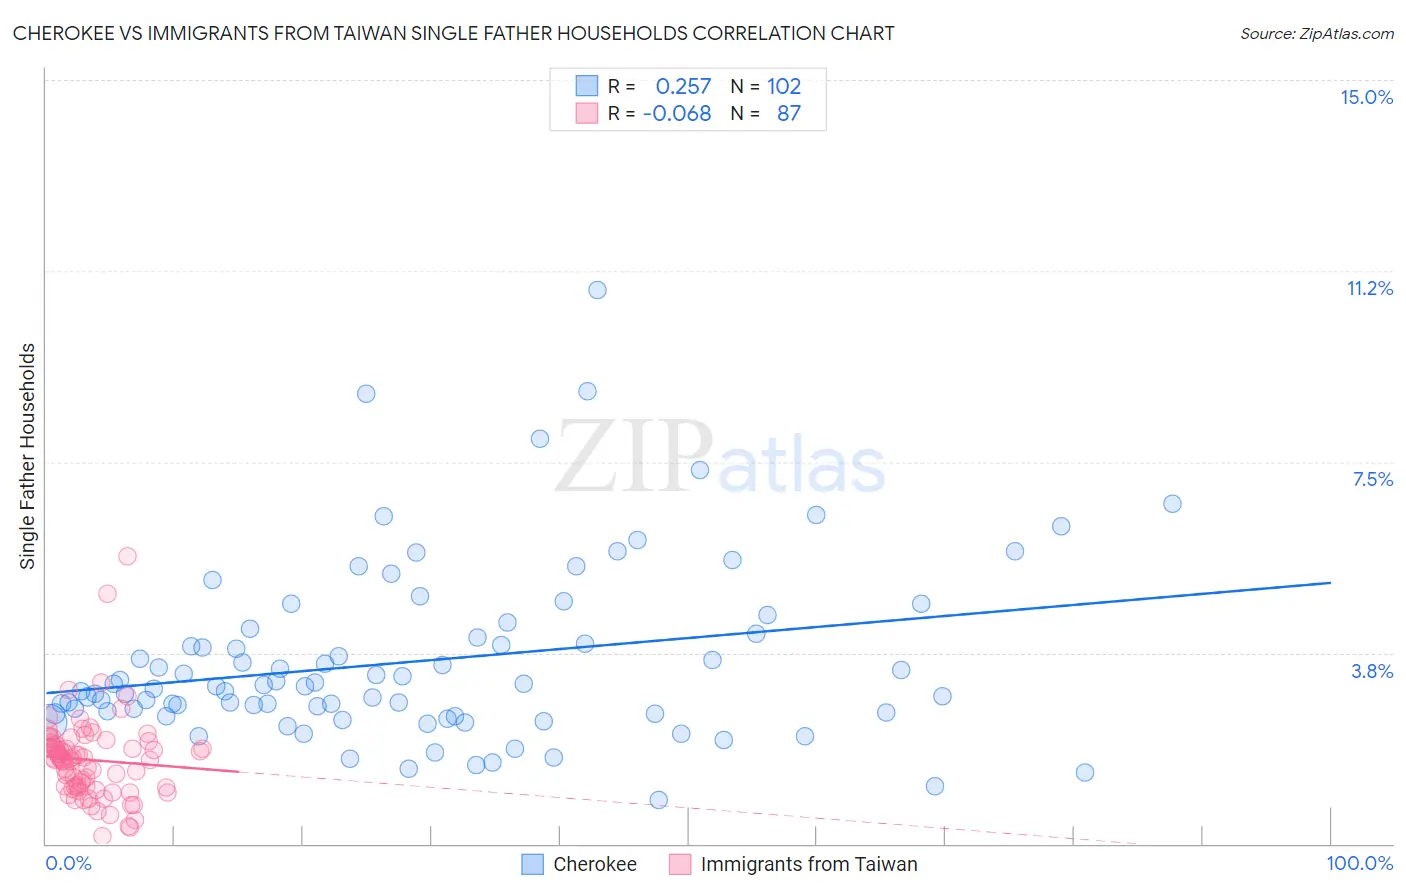
Cherokee vs Immigrants from Taiwan Single Father Households Correlation Chart
The statistical analysis conducted on geographies consisting of 486,508,076 people shows a weak positive correlation between the proportion of Cherokee and percentage of single father households in the United States with a correlation coefficient (R) of 0.257 and weighted average of 2.6%. Similarly, the statistical analysis conducted on geographies consisting of 296,358,565 people shows a slight negative correlation between the proportion of Immigrants from Taiwan and percentage of single father households in the United States with a correlation coefficient (R) of -0.068 and weighted average of 1.8%, a difference of 42.6%.
Single Father Households Correlation Summary
| Measurement | Cherokee | Immigrants from Taiwan |
| Minimum | 0.86% | 0.15% |
| Maximum | 10.9% | 5.7% |
| Range | 10.0% | 5.5% |
| Mean | 3.6% | 1.6% |
| Median | 3.1% | 1.7% |
| Interquartile 25% (IQ1) | 2.6% | 1.1% |
| Interquartile 75% (IQ3) | 4.1% | 1.9% |
| Interquartile Range (IQR) | 1.6% | 0.84% |
| Standard Deviation (Sample) | 1.7% | 0.82% |
| Standard Deviation (Population) | 1.7% | 0.82% |
Similar Demographics by Single Father Households
Demographics Similar to Cherokee by Single Father Households
In terms of single father households, the demographic groups most similar to Cherokee are Samoan (2.6%, a difference of 0.040%), Shoshone (2.6%, a difference of 0.050%), Immigrants from Haiti (2.6%, a difference of 0.080%), Immigrants from Dominican Republic (2.6%, a difference of 0.29%), and Immigrants from Portugal (2.6%, a difference of 0.59%).
| Demographics | Rating | Rank | Single Father Households |
| Creek | 0.2 /100 | #271 | Tragic 2.6% |
| Belizeans | 0.2 /100 | #272 | Tragic 2.6% |
| Iroquois | 0.2 /100 | #273 | Tragic 2.6% |
| Puerto Ricans | 0.2 /100 | #274 | Tragic 2.6% |
| Immigrants | Dominican Republic | 0.2 /100 | #275 | Tragic 2.6% |
| Immigrants | Haiti | 0.1 /100 | #276 | Tragic 2.6% |
| Shoshone | 0.1 /100 | #277 | Tragic 2.6% |
| Cherokee | 0.1 /100 | #278 | Tragic 2.6% |
| Samoans | 0.1 /100 | #279 | Tragic 2.6% |
| Immigrants | Portugal | 0.1 /100 | #280 | Tragic 2.6% |
| Nicaraguans | 0.1 /100 | #281 | Tragic 2.6% |
| Dutch West Indians | 0.1 /100 | #282 | Tragic 2.6% |
| Immigrants | Nicaragua | 0.1 /100 | #283 | Tragic 2.7% |
| Hawaiians | 0.1 /100 | #284 | Tragic 2.7% |
| Ottawa | 0.1 /100 | #285 | Tragic 2.7% |
Demographics Similar to Immigrants from Taiwan by Single Father Households
In terms of single father households, the demographic groups most similar to Immigrants from Taiwan are Cypriot (1.8%, a difference of 0.16%), Immigrants from Ireland (1.8%, a difference of 0.27%), Immigrants from Hong Kong (1.8%, a difference of 0.37%), Immigrants from China (1.8%, a difference of 0.40%), and Okinawan (1.9%, a difference of 0.76%).
| Demographics | Rating | Rank | Single Father Households |
| Soviet Union | 100.0 /100 | #1 | Exceptional 1.8% |
| Immigrants | Israel | 100.0 /100 | #2 | Exceptional 1.8% |
| Filipinos | 100.0 /100 | #3 | Exceptional 1.8% |
| Immigrants | Uzbekistan | 100.0 /100 | #4 | Exceptional 1.8% |
| Immigrants | Hong Kong | 100.0 /100 | #5 | Exceptional 1.8% |
| Immigrants | Taiwan | 100.0 /100 | #6 | Exceptional 1.8% |
| Cypriots | 100.0 /100 | #7 | Exceptional 1.8% |
| Immigrants | Ireland | 100.0 /100 | #8 | Exceptional 1.8% |
| Immigrants | China | 100.0 /100 | #9 | Exceptional 1.8% |
| Okinawans | 100.0 /100 | #10 | Exceptional 1.9% |
| Immigrants | Belarus | 100.0 /100 | #11 | Exceptional 1.9% |
| Immigrants | Greece | 100.0 /100 | #12 | Exceptional 1.9% |
| Immigrants | Singapore | 100.0 /100 | #13 | Exceptional 1.9% |
| Immigrants | Lithuania | 100.0 /100 | #14 | Exceptional 1.9% |
| Immigrants | Eastern Asia | 100.0 /100 | #15 | Exceptional 1.9% |