Central American vs Sierra Leonean Births to Unmarried Women
COMPARE
Central American
Sierra Leonean
Births to Unmarried Women
Births to Unmarried Women Comparison
Central Americans
Sierra Leoneans
36.7%
BIRTHS TO UNMARRIED WOMEN
0.1/ 100
METRIC RATING
267th/ 347
METRIC RANK
34.9%
BIRTHS TO UNMARRIED WOMEN
1.4/ 100
METRIC RATING
239th/ 347
METRIC RANK
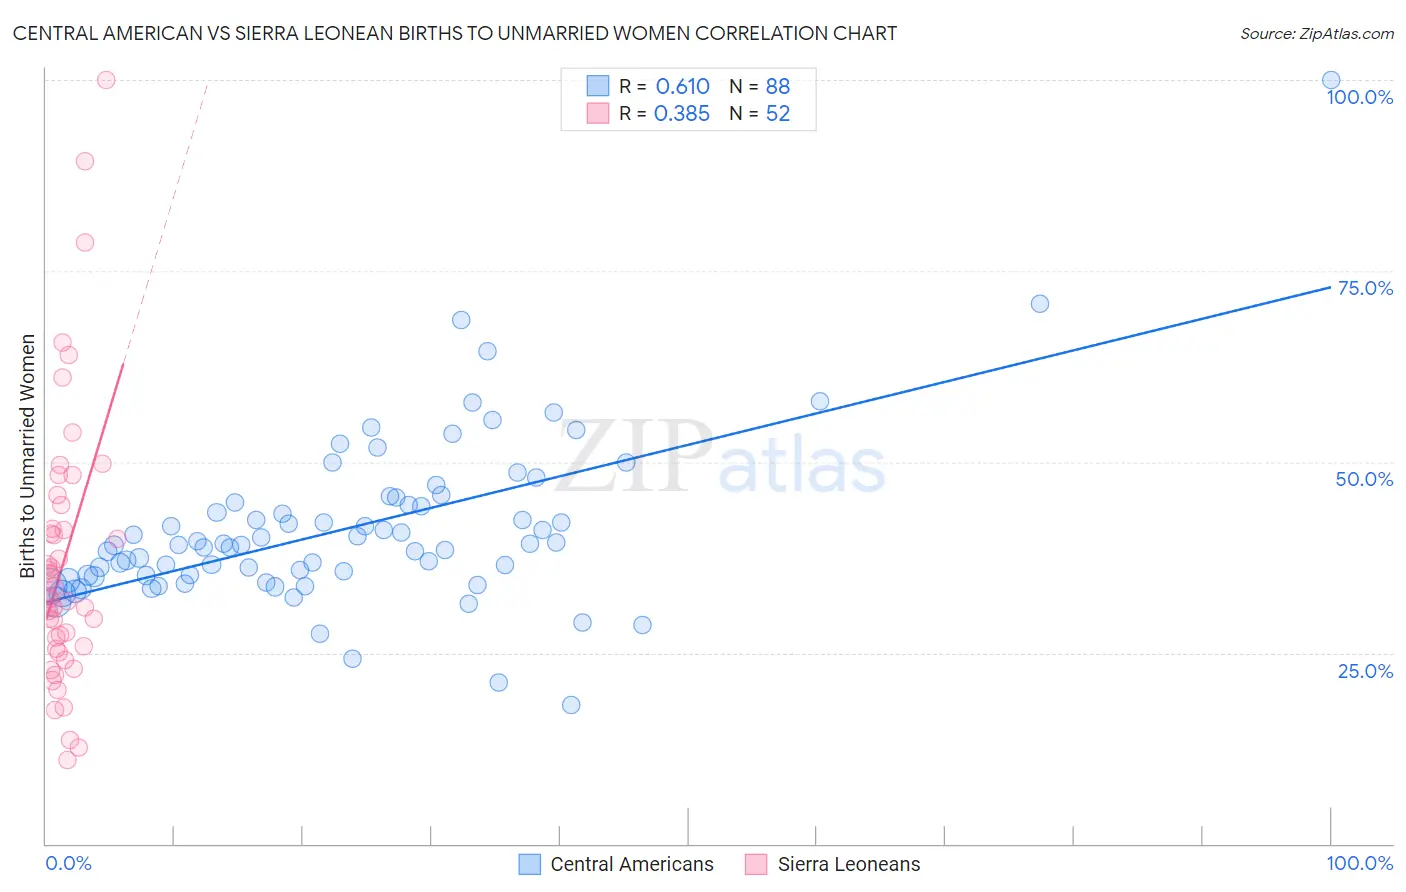
Central American vs Sierra Leonean Births to Unmarried Women Correlation Chart
The statistical analysis conducted on geographies consisting of 464,543,910 people shows a significant positive correlation between the proportion of Central Americans and percentage of births to unmarried women in the United States with a correlation coefficient (R) of 0.610 and weighted average of 36.7%. Similarly, the statistical analysis conducted on geographies consisting of 82,118,430 people shows a mild positive correlation between the proportion of Sierra Leoneans and percentage of births to unmarried women in the United States with a correlation coefficient (R) of 0.385 and weighted average of 34.9%, a difference of 5.3%.
Births to Unmarried Women Correlation Summary
| Measurement | Central American | Sierra Leonean |
| Minimum | 18.1% | 11.0% |
| Maximum | 100.0% | 100.0% |
| Range | 81.9% | 89.0% |
| Mean | 41.3% | 37.0% |
| Median | 39.1% | 32.2% |
| Interquartile 25% (IQ1) | 35.0% | 25.7% |
| Interquartile 75% (IQ3) | 44.6% | 42.9% |
| Interquartile Range (IQR) | 9.5% | 17.1% |
| Standard Deviation (Sample) | 11.2% | 18.0% |
| Standard Deviation (Population) | 11.1% | 17.9% |
Similar Demographics by Births to Unmarried Women
Demographics Similar to Central Americans by Births to Unmarried Women
In terms of births to unmarried women, the demographic groups most similar to Central Americans are Comanche (36.7%, a difference of 0.010%), Immigrants from Senegal (36.7%, a difference of 0.070%), Cherokee (36.7%, a difference of 0.12%), Senegalese (36.8%, a difference of 0.13%), and Subsaharan African (36.7%, a difference of 0.17%).
| Demographics | Rating | Rank | Births to Unmarried Women |
| Ottawa | 0.2 /100 | #260 | Tragic 36.5% |
| Trinidadians and Tobagonians | 0.2 /100 | #261 | Tragic 36.5% |
| French American Indians | 0.1 /100 | #262 | Tragic 36.6% |
| Nicaraguans | 0.1 /100 | #263 | Tragic 36.6% |
| Sub-Saharan Africans | 0.1 /100 | #264 | Tragic 36.7% |
| Cherokee | 0.1 /100 | #265 | Tragic 36.7% |
| Immigrants | Senegal | 0.1 /100 | #266 | Tragic 36.7% |
| Central Americans | 0.1 /100 | #267 | Tragic 36.7% |
| Comanche | 0.1 /100 | #268 | Tragic 36.7% |
| Senegalese | 0.1 /100 | #269 | Tragic 36.8% |
| Immigrants | Congo | 0.1 /100 | #270 | Tragic 36.8% |
| Immigrants | Barbados | 0.1 /100 | #271 | Tragic 36.8% |
| Choctaw | 0.1 /100 | #272 | Tragic 36.9% |
| Mexicans | 0.1 /100 | #273 | Tragic 36.9% |
| Cree | 0.1 /100 | #274 | Tragic 37.0% |
Demographics Similar to Sierra Leoneans by Births to Unmarried Women
In terms of births to unmarried women, the demographic groups most similar to Sierra Leoneans are Immigrants from Cambodia (34.8%, a difference of 0.22%), Immigrants from Middle Africa (34.9%, a difference of 0.25%), Marshallese (34.8%, a difference of 0.28%), Immigrants from Guyana (35.0%, a difference of 0.28%), and Immigrants from Cameroon (34.7%, a difference of 0.36%).
| Demographics | Rating | Rank | Births to Unmarried Women |
| French Canadians | 2.5 /100 | #232 | Tragic 34.4% |
| Bangladeshis | 2.5 /100 | #233 | Tragic 34.4% |
| Immigrants | Zaire | 2.3 /100 | #234 | Tragic 34.5% |
| Immigrants | Ghana | 2.2 /100 | #235 | Tragic 34.5% |
| Immigrants | Cameroon | 1.6 /100 | #236 | Tragic 34.7% |
| Marshallese | 1.6 /100 | #237 | Tragic 34.8% |
| Immigrants | Cambodia | 1.6 /100 | #238 | Tragic 34.8% |
| Sierra Leoneans | 1.4 /100 | #239 | Tragic 34.9% |
| Immigrants | Middle Africa | 1.2 /100 | #240 | Tragic 34.9% |
| Immigrants | Guyana | 1.2 /100 | #241 | Tragic 35.0% |
| Indonesians | 1.2 /100 | #242 | Tragic 35.0% |
| Japanese | 0.9 /100 | #243 | Tragic 35.2% |
| Guyanese | 0.9 /100 | #244 | Tragic 35.2% |
| Shoshone | 0.8 /100 | #245 | Tragic 35.3% |
| Nigerians | 0.7 /100 | #246 | Tragic 35.3% |