Lumbee vs South American Currently Married
COMPARE
Lumbee
South American
Currently Married
Currently Married Comparison
Lumbee
South Americans
39.8%
CURRENTLY MARRIED
0.0/ 100
METRIC RATING
335th/ 347
METRIC RANK
46.1%
CURRENTLY MARRIED
23.8/ 100
METRIC RATING
194th/ 347
METRIC RANK
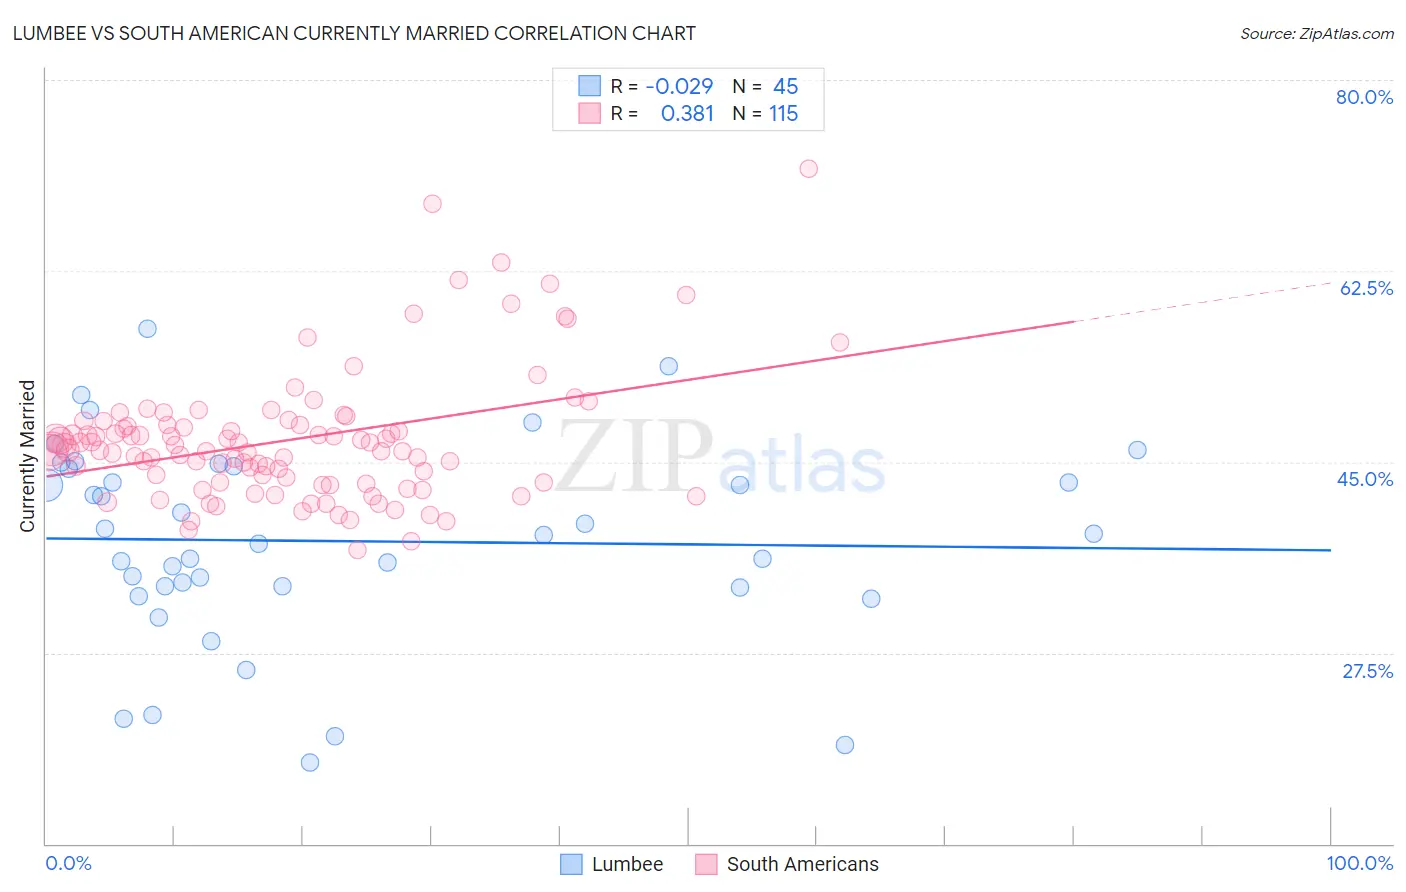
Lumbee vs South American Currently Married Correlation Chart
The statistical analysis conducted on geographies consisting of 92,298,299 people shows no correlation between the proportion of Lumbee and percentage of population currently married in the United States with a correlation coefficient (R) of -0.029 and weighted average of 39.8%. Similarly, the statistical analysis conducted on geographies consisting of 494,081,354 people shows a mild positive correlation between the proportion of South Americans and percentage of population currently married in the United States with a correlation coefficient (R) of 0.381 and weighted average of 46.1%, a difference of 15.8%.
Currently Married Correlation Summary
| Measurement | Lumbee | South American |
| Minimum | 17.4% | 37.0% |
| Maximum | 57.2% | 71.9% |
| Range | 39.8% | 34.9% |
| Mean | 37.7% | 47.0% |
| Median | 38.3% | 46.1% |
| Interquartile 25% (IQ1) | 33.5% | 43.1% |
| Interquartile 75% (IQ3) | 44.5% | 48.4% |
| Interquartile Range (IQR) | 10.9% | 5.3% |
| Standard Deviation (Sample) | 9.1% | 6.0% |
| Standard Deviation (Population) | 9.0% | 6.0% |
Similar Demographics by Currently Married
Demographics Similar to Lumbee by Currently Married
In terms of currently married, the demographic groups most similar to Lumbee are Puerto Rican (39.9%, a difference of 0.16%), Yup'ik (39.9%, a difference of 0.18%), British West Indian (39.8%, a difference of 0.18%), Black/African American (39.6%, a difference of 0.56%), and Immigrants from St. Vincent and the Grenadines (40.1%, a difference of 0.57%).
| Demographics | Rating | Rank | Currently Married |
| Arapaho | 0.0 /100 | #328 | Tragic 40.5% |
| Crow | 0.0 /100 | #329 | Tragic 40.4% |
| Immigrants | Dominica | 0.0 /100 | #330 | Tragic 40.3% |
| Immigrants | Barbados | 0.0 /100 | #331 | Tragic 40.3% |
| Immigrants | St. Vincent and the Grenadines | 0.0 /100 | #332 | Tragic 40.1% |
| Yup'ik | 0.0 /100 | #333 | Tragic 39.9% |
| Puerto Ricans | 0.0 /100 | #334 | Tragic 39.9% |
| Lumbee | 0.0 /100 | #335 | Tragic 39.8% |
| British West Indians | 0.0 /100 | #336 | Tragic 39.8% |
| Blacks/African Americans | 0.0 /100 | #337 | Tragic 39.6% |
| Cape Verdeans | 0.0 /100 | #338 | Tragic 39.6% |
| Dominicans | 0.0 /100 | #339 | Tragic 39.5% |
| Immigrants | Grenada | 0.0 /100 | #340 | Tragic 39.1% |
| Navajo | 0.0 /100 | #341 | Tragic 39.0% |
| Immigrants | Dominican Republic | 0.0 /100 | #342 | Tragic 38.9% |
Demographics Similar to South Americans by Currently Married
In terms of currently married, the demographic groups most similar to South Americans are Immigrants from Nepal (46.1%, a difference of 0.010%), Immigrants from Fiji (46.2%, a difference of 0.060%), Immigrants from Bosnia and Herzegovina (46.1%, a difference of 0.080%), Soviet Union (46.2%, a difference of 0.10%), and Immigrants from Kuwait (46.1%, a difference of 0.11%).
| Demographics | Rating | Rank | Currently Married |
| Immigrants | Peru | 35.3 /100 | #187 | Fair 46.4% |
| Colombians | 31.8 /100 | #188 | Fair 46.3% |
| Fijians | 30.3 /100 | #189 | Fair 46.3% |
| Choctaw | 29.1 /100 | #190 | Fair 46.3% |
| Immigrants | France | 27.7 /100 | #191 | Fair 46.2% |
| Soviet Union | 25.7 /100 | #192 | Fair 46.2% |
| Immigrants | Fiji | 25.0 /100 | #193 | Fair 46.2% |
| South Americans | 23.8 /100 | #194 | Fair 46.1% |
| Immigrants | Nepal | 23.7 /100 | #195 | Fair 46.1% |
| Immigrants | Bosnia and Herzegovina | 22.2 /100 | #196 | Fair 46.1% |
| Immigrants | Kuwait | 21.7 /100 | #197 | Fair 46.1% |
| Immigrants | Colombia | 21.0 /100 | #198 | Fair 46.1% |
| Immigrants | Costa Rica | 19.6 /100 | #199 | Poor 46.0% |
| Creek | 17.2 /100 | #200 | Poor 46.0% |
| Malaysians | 15.3 /100 | #201 | Poor 45.9% |