Celtic vs Bangladeshi Average Family Size
COMPARE
Celtic
Bangladeshi
Average Family Size
Average Family Size Comparison
Celtics
Bangladeshis
3.11
AVERAGE FAMILY SIZE
0.0/ 100
METRIC RATING
324th/ 347
METRIC RANK
3.37
AVERAGE FAMILY SIZE
100.0/ 100
METRIC RATING
49th/ 347
METRIC RANK
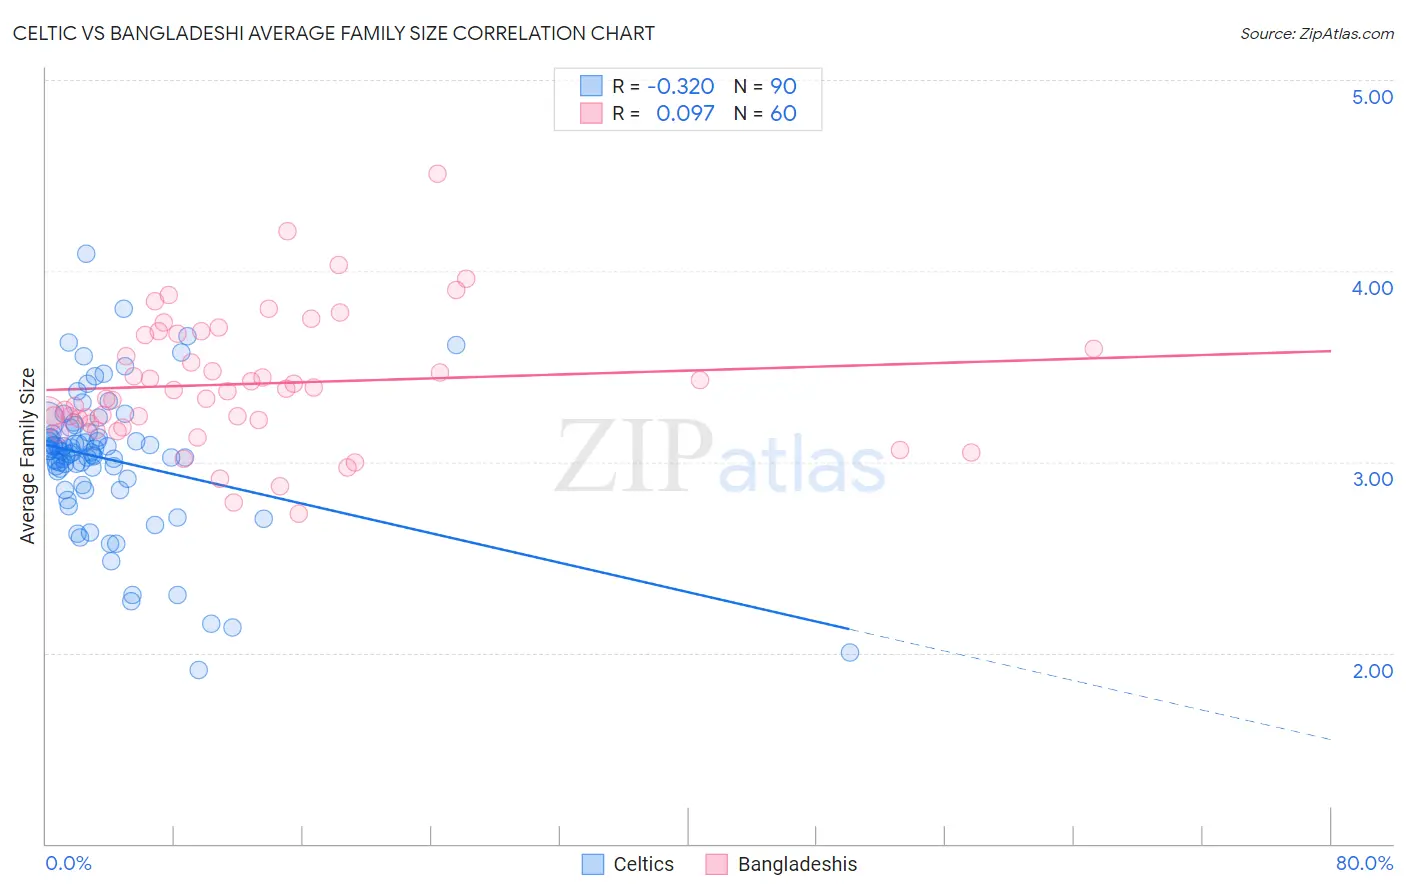
Celtic vs Bangladeshi Average Family Size Correlation Chart
The statistical analysis conducted on geographies consisting of 168,846,519 people shows a mild negative correlation between the proportion of Celtics and average family size in the United States with a correlation coefficient (R) of -0.320 and weighted average of 3.11. Similarly, the statistical analysis conducted on geographies consisting of 141,330,696 people shows a slight positive correlation between the proportion of Bangladeshis and average family size in the United States with a correlation coefficient (R) of 0.097 and weighted average of 3.37, a difference of 8.2%.
Average Family Size Correlation Summary
| Measurement | Celtic | Bangladeshi |
| Minimum | 1.91 | 2.73 |
| Maximum | 4.09 | 4.51 |
| Range | 2.18 | 1.78 |
| Mean | 3.01 | 3.41 |
| Median | 3.05 | 3.37 |
| Interquartile 25% (IQ1) | 2.91 | 3.21 |
| Interquartile 75% (IQ3) | 3.15 | 3.67 |
| Interquartile Range (IQR) | 0.24 | 0.46 |
| Standard Deviation (Sample) | 0.37 | 0.34 |
| Standard Deviation (Population) | 0.37 | 0.34 |
Similar Demographics by Average Family Size
Demographics Similar to Celtics by Average Family Size
In terms of average family size, the demographic groups most similar to Celtics are English (3.11, a difference of 0.040%), Soviet Union (3.11, a difference of 0.080%), Ottawa (3.11, a difference of 0.090%), Dutch (3.11, a difference of 0.10%), and Czech (3.11, a difference of 0.10%).
| Demographics | Rating | Rank | Average Family Size |
| Italians | 0.1 /100 | #317 | Tragic 3.12 |
| Eastern Europeans | 0.1 /100 | #318 | Tragic 3.12 |
| Welsh | 0.1 /100 | #319 | Tragic 3.12 |
| Immigrants | North America | 0.0 /100 | #320 | Tragic 3.12 |
| Immigrants | Austria | 0.0 /100 | #321 | Tragic 3.12 |
| Immigrants | Canada | 0.0 /100 | #322 | Tragic 3.12 |
| Soviet Union | 0.0 /100 | #323 | Tragic 3.11 |
| Celtics | 0.0 /100 | #324 | Tragic 3.11 |
| English | 0.0 /100 | #325 | Tragic 3.11 |
| Ottawa | 0.0 /100 | #326 | Tragic 3.11 |
| Dutch | 0.0 /100 | #327 | Tragic 3.11 |
| Czechs | 0.0 /100 | #328 | Tragic 3.11 |
| Belgians | 0.0 /100 | #329 | Tragic 3.11 |
| Latvians | 0.0 /100 | #330 | Tragic 3.11 |
| Scotch-Irish | 0.0 /100 | #331 | Tragic 3.11 |
Demographics Similar to Bangladeshis by Average Family Size
In terms of average family size, the demographic groups most similar to Bangladeshis are Immigrants from Nicaragua (3.37, a difference of 0.060%), Vietnamese (3.37, a difference of 0.070%), Haitian (3.37, a difference of 0.11%), Immigrants from Bangladesh (3.36, a difference of 0.14%), and Shoshone (3.37, a difference of 0.16%).
| Demographics | Rating | Rank | Average Family Size |
| Immigrants | Vietnam | 100.0 /100 | #42 | Exceptional 3.38 |
| Immigrants | Philippines | 100.0 /100 | #43 | Exceptional 3.37 |
| Alaska Natives | 100.0 /100 | #44 | Exceptional 3.37 |
| Shoshone | 100.0 /100 | #45 | Exceptional 3.37 |
| Haitians | 100.0 /100 | #46 | Exceptional 3.37 |
| Vietnamese | 100.0 /100 | #47 | Exceptional 3.37 |
| Immigrants | Nicaragua | 100.0 /100 | #48 | Exceptional 3.37 |
| Bangladeshis | 100.0 /100 | #49 | Exceptional 3.37 |
| Immigrants | Bangladesh | 100.0 /100 | #50 | Exceptional 3.36 |
| Nicaraguans | 100.0 /100 | #51 | Exceptional 3.36 |
| Fijians | 100.0 /100 | #52 | Exceptional 3.36 |
| Koreans | 100.0 /100 | #53 | Exceptional 3.36 |
| Immigrants | South Eastern Asia | 100.0 /100 | #54 | Exceptional 3.36 |
| Immigrants | Honduras | 100.0 /100 | #55 | Exceptional 3.36 |
| Immigrants | Dominican Republic | 100.0 /100 | #56 | Exceptional 3.35 |