Celtic vs Bahamian Average Family Size
COMPARE
Celtic
Bahamian
Average Family Size
Average Family Size Comparison
Celtics
Bahamians
3.11
AVERAGE FAMILY SIZE
0.0/ 100
METRIC RATING
324th/ 347
METRIC RANK
3.28
AVERAGE FAMILY SIZE
96.6/ 100
METRIC RATING
110th/ 347
METRIC RANK
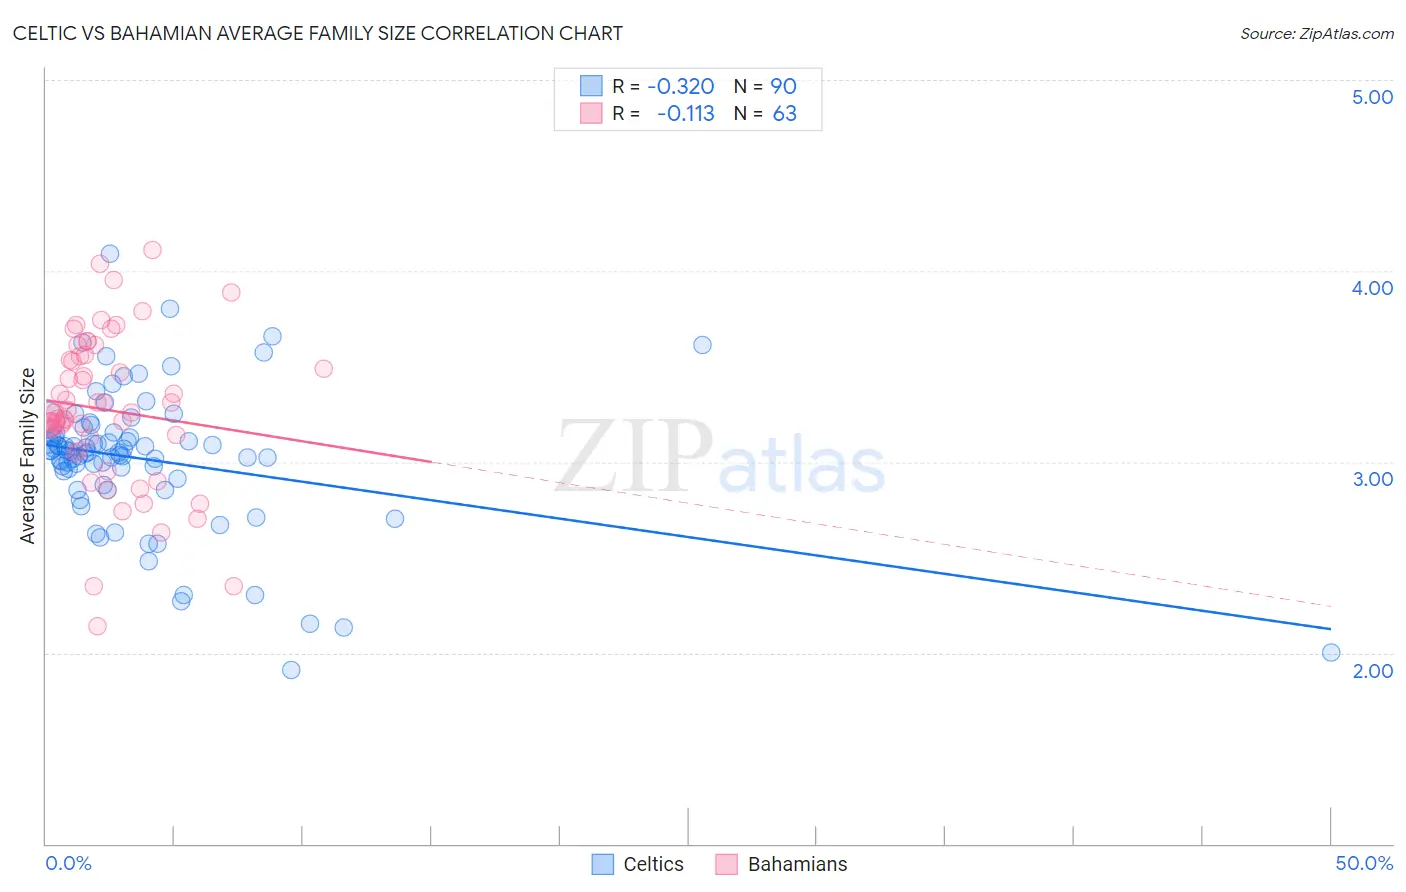
Celtic vs Bahamian Average Family Size Correlation Chart
The statistical analysis conducted on geographies consisting of 168,846,519 people shows a mild negative correlation between the proportion of Celtics and average family size in the United States with a correlation coefficient (R) of -0.320 and weighted average of 3.11. Similarly, the statistical analysis conducted on geographies consisting of 112,635,727 people shows a poor negative correlation between the proportion of Bahamians and average family size in the United States with a correlation coefficient (R) of -0.113 and weighted average of 3.28, a difference of 5.3%.
Average Family Size Correlation Summary
| Measurement | Celtic | Bahamian |
| Minimum | 1.91 | 2.14 |
| Maximum | 4.09 | 4.11 |
| Range | 2.18 | 1.97 |
| Mean | 3.01 | 3.27 |
| Median | 3.05 | 3.26 |
| Interquartile 25% (IQ1) | 2.91 | 3.13 |
| Interquartile 75% (IQ3) | 3.15 | 3.55 |
| Interquartile Range (IQR) | 0.24 | 0.42 |
| Standard Deviation (Sample) | 0.37 | 0.40 |
| Standard Deviation (Population) | 0.37 | 0.39 |
Similar Demographics by Average Family Size
Demographics Similar to Celtics by Average Family Size
In terms of average family size, the demographic groups most similar to Celtics are English (3.11, a difference of 0.040%), Soviet Union (3.11, a difference of 0.080%), Ottawa (3.11, a difference of 0.090%), Dutch (3.11, a difference of 0.10%), and Czech (3.11, a difference of 0.10%).
| Demographics | Rating | Rank | Average Family Size |
| Italians | 0.1 /100 | #317 | Tragic 3.12 |
| Eastern Europeans | 0.1 /100 | #318 | Tragic 3.12 |
| Welsh | 0.1 /100 | #319 | Tragic 3.12 |
| Immigrants | North America | 0.0 /100 | #320 | Tragic 3.12 |
| Immigrants | Austria | 0.0 /100 | #321 | Tragic 3.12 |
| Immigrants | Canada | 0.0 /100 | #322 | Tragic 3.12 |
| Soviet Union | 0.0 /100 | #323 | Tragic 3.11 |
| Celtics | 0.0 /100 | #324 | Tragic 3.11 |
| English | 0.0 /100 | #325 | Tragic 3.11 |
| Ottawa | 0.0 /100 | #326 | Tragic 3.11 |
| Dutch | 0.0 /100 | #327 | Tragic 3.11 |
| Czechs | 0.0 /100 | #328 | Tragic 3.11 |
| Belgians | 0.0 /100 | #329 | Tragic 3.11 |
| Latvians | 0.0 /100 | #330 | Tragic 3.11 |
| Scotch-Irish | 0.0 /100 | #331 | Tragic 3.11 |
Demographics Similar to Bahamians by Average Family Size
In terms of average family size, the demographic groups most similar to Bahamians are Puerto Rican (3.28, a difference of 0.020%), Indonesian (3.28, a difference of 0.050%), Asian (3.28, a difference of 0.060%), Black/African American (3.27, a difference of 0.11%), and Immigrants from Panama (3.27, a difference of 0.12%).
| Demographics | Rating | Rank | Average Family Size |
| Immigrants | Western Africa | 98.4 /100 | #103 | Exceptional 3.29 |
| Bolivians | 98.3 /100 | #104 | Exceptional 3.29 |
| Immigrants | Ghana | 98.1 /100 | #105 | Exceptional 3.29 |
| Paiute | 98.0 /100 | #106 | Exceptional 3.29 |
| Ghanaians | 98.0 /100 | #107 | Exceptional 3.29 |
| Asians | 97.0 /100 | #108 | Exceptional 3.28 |
| Puerto Ricans | 96.7 /100 | #109 | Exceptional 3.28 |
| Bahamians | 96.6 /100 | #110 | Exceptional 3.28 |
| Indonesians | 96.2 /100 | #111 | Exceptional 3.28 |
| Blacks/African Americans | 95.7 /100 | #112 | Exceptional 3.27 |
| Immigrants | Panama | 95.6 /100 | #113 | Exceptional 3.27 |
| South Americans | 95.1 /100 | #114 | Exceptional 3.27 |
| Immigrants | Liberia | 95.0 /100 | #115 | Exceptional 3.27 |
| Immigrants | South America | 95.0 /100 | #116 | Exceptional 3.27 |
| Kiowa | 94.8 /100 | #117 | Exceptional 3.27 |