Celtic vs Central American Single Father Households
COMPARE
Celtic
Central American
Single Father Households
Single Father Households Comparison
Celtics
Central Americans
2.3%
SINGLE FATHER HOUSEHOLDS
55.4/ 100
METRIC RATING
173rd/ 347
METRIC RANK
2.9%
SINGLE FATHER HOUSEHOLDS
0.0/ 100
METRIC RATING
309th/ 347
METRIC RANK
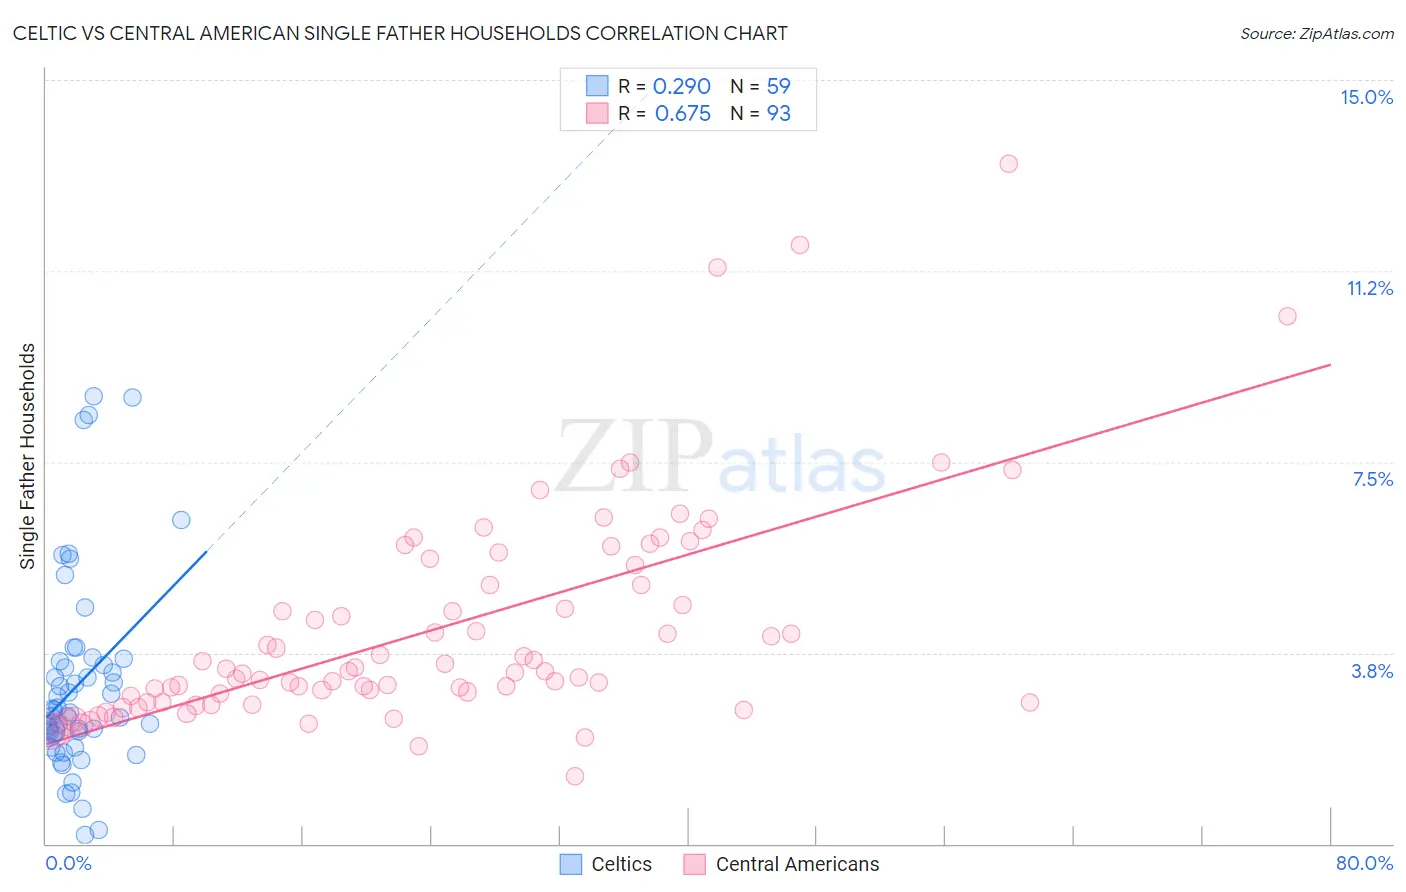
Celtic vs Central American Single Father Households Correlation Chart
The statistical analysis conducted on geographies consisting of 168,269,233 people shows a weak positive correlation between the proportion of Celtics and percentage of single father households in the United States with a correlation coefficient (R) of 0.290 and weighted average of 2.3%. Similarly, the statistical analysis conducted on geographies consisting of 497,759,507 people shows a significant positive correlation between the proportion of Central Americans and percentage of single father households in the United States with a correlation coefficient (R) of 0.675 and weighted average of 2.9%, a difference of 22.6%.
Single Father Households Correlation Summary
| Measurement | Celtic | Central American |
| Minimum | 0.17% | 1.3% |
| Maximum | 8.8% | 13.4% |
| Range | 8.6% | 12.0% |
| Mean | 3.1% | 4.2% |
| Median | 2.6% | 3.4% |
| Interquartile 25% (IQ1) | 2.2% | 2.8% |
| Interquartile 75% (IQ3) | 3.6% | 5.3% |
| Interquartile Range (IQR) | 1.4% | 2.5% |
| Standard Deviation (Sample) | 1.9% | 2.2% |
| Standard Deviation (Population) | 1.9% | 2.2% |
Similar Demographics by Single Father Households
Demographics Similar to Celtics by Single Father Households
In terms of single father households, the demographic groups most similar to Celtics are Czechoslovakian (2.3%, a difference of 0.26%), Afghan (2.3%, a difference of 0.40%), Swedish (2.3%, a difference of 0.47%), Immigrants from Jamaica (2.3%, a difference of 0.47%), and Ugandan (2.3%, a difference of 0.52%).
| Demographics | Rating | Rank | Single Father Households |
| English | 68.6 /100 | #166 | Good 2.3% |
| South Americans | 64.3 /100 | #167 | Good 2.3% |
| Icelanders | 63.1 /100 | #168 | Good 2.3% |
| Czechs | 62.5 /100 | #169 | Good 2.3% |
| Ugandans | 62.2 /100 | #170 | Good 2.3% |
| Swedes | 61.6 /100 | #171 | Good 2.3% |
| Czechoslovakians | 58.9 /100 | #172 | Average 2.3% |
| Celtics | 55.4 /100 | #173 | Average 2.3% |
| Afghans | 50.0 /100 | #174 | Average 2.3% |
| Immigrants | Jamaica | 49.1 /100 | #175 | Average 2.3% |
| Danes | 48.2 /100 | #176 | Average 2.3% |
| Colombians | 48.0 /100 | #177 | Average 2.3% |
| Costa Ricans | 44.1 /100 | #178 | Average 2.3% |
| Welsh | 44.0 /100 | #179 | Average 2.3% |
| Yugoslavians | 43.9 /100 | #180 | Average 2.3% |
Demographics Similar to Central Americans by Single Father Households
In terms of single father households, the demographic groups most similar to Central Americans are Immigrants from Laos (2.9%, a difference of 0.21%), Spanish American Indian (2.9%, a difference of 0.69%), Apache (2.8%, a difference of 0.71%), Hopi (2.8%, a difference of 0.89%), and Immigrants from the Azores (2.8%, a difference of 1.1%).
| Demographics | Rating | Rank | Single Father Households |
| Spanish Americans | 0.0 /100 | #302 | Tragic 2.8% |
| Immigrants | Honduras | 0.0 /100 | #303 | Tragic 2.8% |
| Mexican American Indians | 0.0 /100 | #304 | Tragic 2.8% |
| Hispanics or Latinos | 0.0 /100 | #305 | Tragic 2.8% |
| Immigrants | Azores | 0.0 /100 | #306 | Tragic 2.8% |
| Hopi | 0.0 /100 | #307 | Tragic 2.8% |
| Apache | 0.0 /100 | #308 | Tragic 2.8% |
| Central Americans | 0.0 /100 | #309 | Tragic 2.9% |
| Immigrants | Laos | 0.0 /100 | #310 | Tragic 2.9% |
| Spanish American Indians | 0.0 /100 | #311 | Tragic 2.9% |
| Tsimshian | 0.0 /100 | #312 | Tragic 2.9% |
| Arapaho | 0.0 /100 | #313 | Tragic 2.9% |
| Salvadorans | 0.0 /100 | #314 | Tragic 2.9% |
| Cheyenne | 0.0 /100 | #315 | Tragic 2.9% |
| Houma | 0.0 /100 | #316 | Tragic 2.9% |