Celtic vs Panamanian Single Father Households
COMPARE
Celtic
Panamanian
Single Father Households
Single Father Households Comparison
Celtics
Panamanians
2.3%
SINGLE FATHER HOUSEHOLDS
55.4/ 100
METRIC RATING
173rd/ 347
METRIC RANK
2.4%
SINGLE FATHER HOUSEHOLDS
29.6/ 100
METRIC RATING
194th/ 347
METRIC RANK
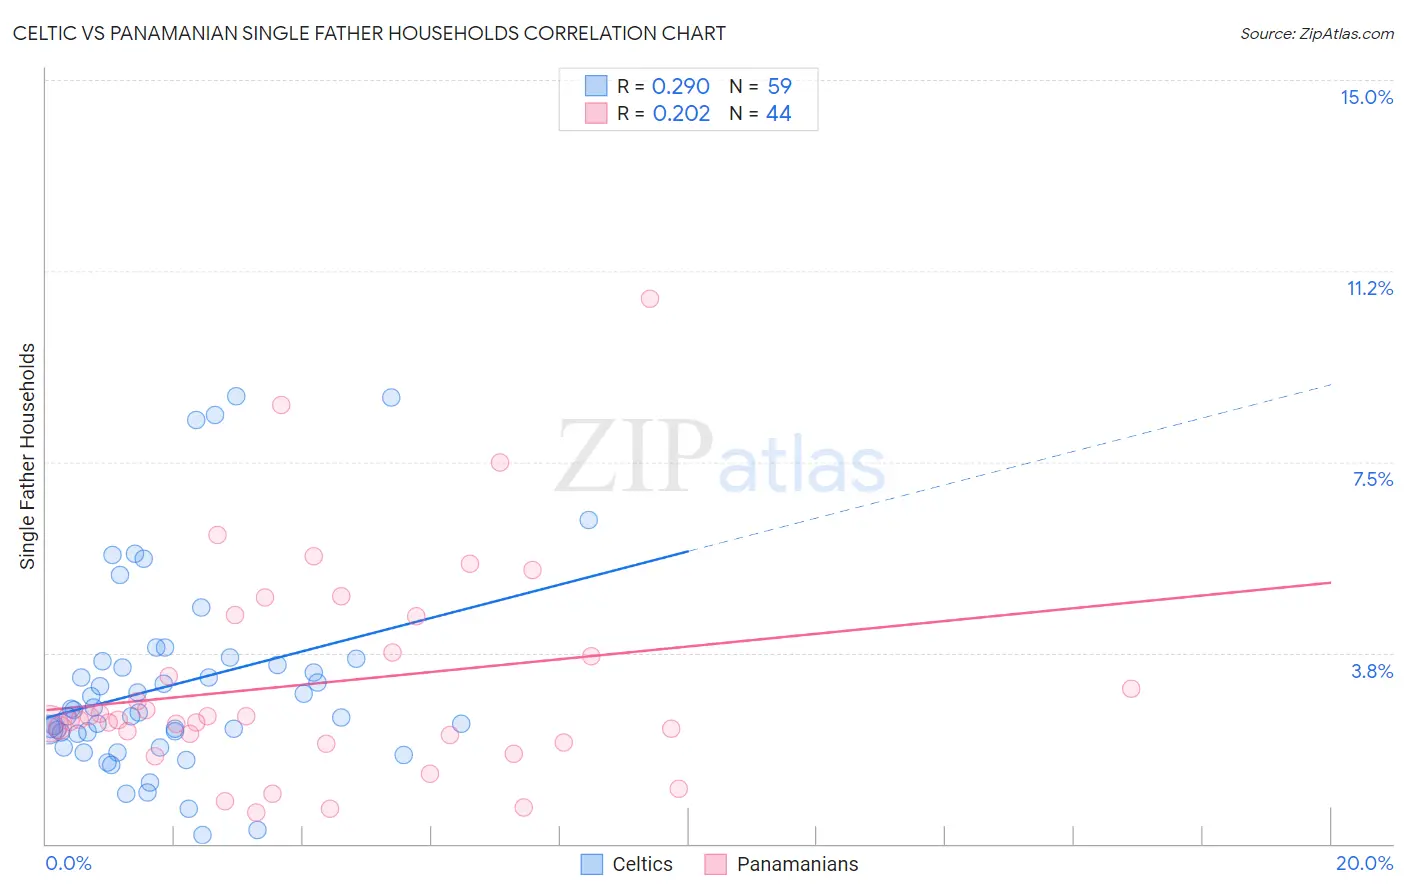
Celtic vs Panamanian Single Father Households Correlation Chart
The statistical analysis conducted on geographies consisting of 168,269,233 people shows a weak positive correlation between the proportion of Celtics and percentage of single father households in the United States with a correlation coefficient (R) of 0.290 and weighted average of 2.3%. Similarly, the statistical analysis conducted on geographies consisting of 279,967,091 people shows a weak positive correlation between the proportion of Panamanians and percentage of single father households in the United States with a correlation coefficient (R) of 0.202 and weighted average of 2.4%, a difference of 2.0%.
Single Father Households Correlation Summary
| Measurement | Celtic | Panamanian |
| Minimum | 0.17% | 0.62% |
| Maximum | 8.8% | 10.7% |
| Range | 8.6% | 10.1% |
| Mean | 3.1% | 3.2% |
| Median | 2.6% | 2.4% |
| Interquartile 25% (IQ1) | 2.2% | 2.1% |
| Interquartile 75% (IQ3) | 3.6% | 4.1% |
| Interquartile Range (IQR) | 1.4% | 2.1% |
| Standard Deviation (Sample) | 1.9% | 2.1% |
| Standard Deviation (Population) | 1.9% | 2.1% |
Similar Demographics by Single Father Households
Demographics Similar to Celtics by Single Father Households
In terms of single father households, the demographic groups most similar to Celtics are Czechoslovakian (2.3%, a difference of 0.26%), Afghan (2.3%, a difference of 0.40%), Swedish (2.3%, a difference of 0.47%), Immigrants from Jamaica (2.3%, a difference of 0.47%), and Ugandan (2.3%, a difference of 0.52%).
| Demographics | Rating | Rank | Single Father Households |
| English | 68.6 /100 | #166 | Good 2.3% |
| South Americans | 64.3 /100 | #167 | Good 2.3% |
| Icelanders | 63.1 /100 | #168 | Good 2.3% |
| Czechs | 62.5 /100 | #169 | Good 2.3% |
| Ugandans | 62.2 /100 | #170 | Good 2.3% |
| Swedes | 61.6 /100 | #171 | Good 2.3% |
| Czechoslovakians | 58.9 /100 | #172 | Average 2.3% |
| Celtics | 55.4 /100 | #173 | Average 2.3% |
| Afghans | 50.0 /100 | #174 | Average 2.3% |
| Immigrants | Jamaica | 49.1 /100 | #175 | Average 2.3% |
| Danes | 48.2 /100 | #176 | Average 2.3% |
| Colombians | 48.0 /100 | #177 | Average 2.3% |
| Costa Ricans | 44.1 /100 | #178 | Average 2.3% |
| Welsh | 44.0 /100 | #179 | Average 2.3% |
| Yugoslavians | 43.9 /100 | #180 | Average 2.3% |
Demographics Similar to Panamanians by Single Father Households
In terms of single father households, the demographic groups most similar to Panamanians are Uruguayan (2.4%, a difference of 0.010%), Immigrants from Sudan (2.4%, a difference of 0.020%), Immigrants from Africa (2.4%, a difference of 0.030%), Immigrants from Philippines (2.4%, a difference of 0.080%), and Kenyan (2.4%, a difference of 0.14%).
| Demographics | Rating | Rank | Single Father Households |
| Immigrants | Colombia | 34.0 /100 | #187 | Fair 2.4% |
| Hmong | 33.0 /100 | #188 | Fair 2.4% |
| U.S. Virgin Islanders | 31.8 /100 | #189 | Fair 2.4% |
| French | 31.7 /100 | #190 | Fair 2.4% |
| Immigrants | Africa | 30.0 /100 | #191 | Fair 2.4% |
| Immigrants | Sudan | 29.8 /100 | #192 | Fair 2.4% |
| Uruguayans | 29.7 /100 | #193 | Fair 2.4% |
| Panamanians | 29.6 /100 | #194 | Fair 2.4% |
| Immigrants | Philippines | 28.7 /100 | #195 | Fair 2.4% |
| Kenyans | 28.0 /100 | #196 | Fair 2.4% |
| Germans | 28.0 /100 | #197 | Fair 2.4% |
| Scandinavians | 27.4 /100 | #198 | Fair 2.4% |
| Immigrants | Vietnam | 27.1 /100 | #199 | Fair 2.4% |
| Peruvians | 27.1 /100 | #200 | Fair 2.4% |
| Immigrants | Uganda | 26.0 /100 | #201 | Fair 2.4% |