Celtic vs Yup'ik Single Father Households
COMPARE
Celtic
Yup'ik
Single Father Households
Single Father Households Comparison
Celtics
Yup'ik
2.3%
SINGLE FATHER HOUSEHOLDS
55.4/ 100
METRIC RATING
173rd/ 347
METRIC RANK
5.4%
SINGLE FATHER HOUSEHOLDS
0.0/ 100
METRIC RATING
347th/ 347
METRIC RANK
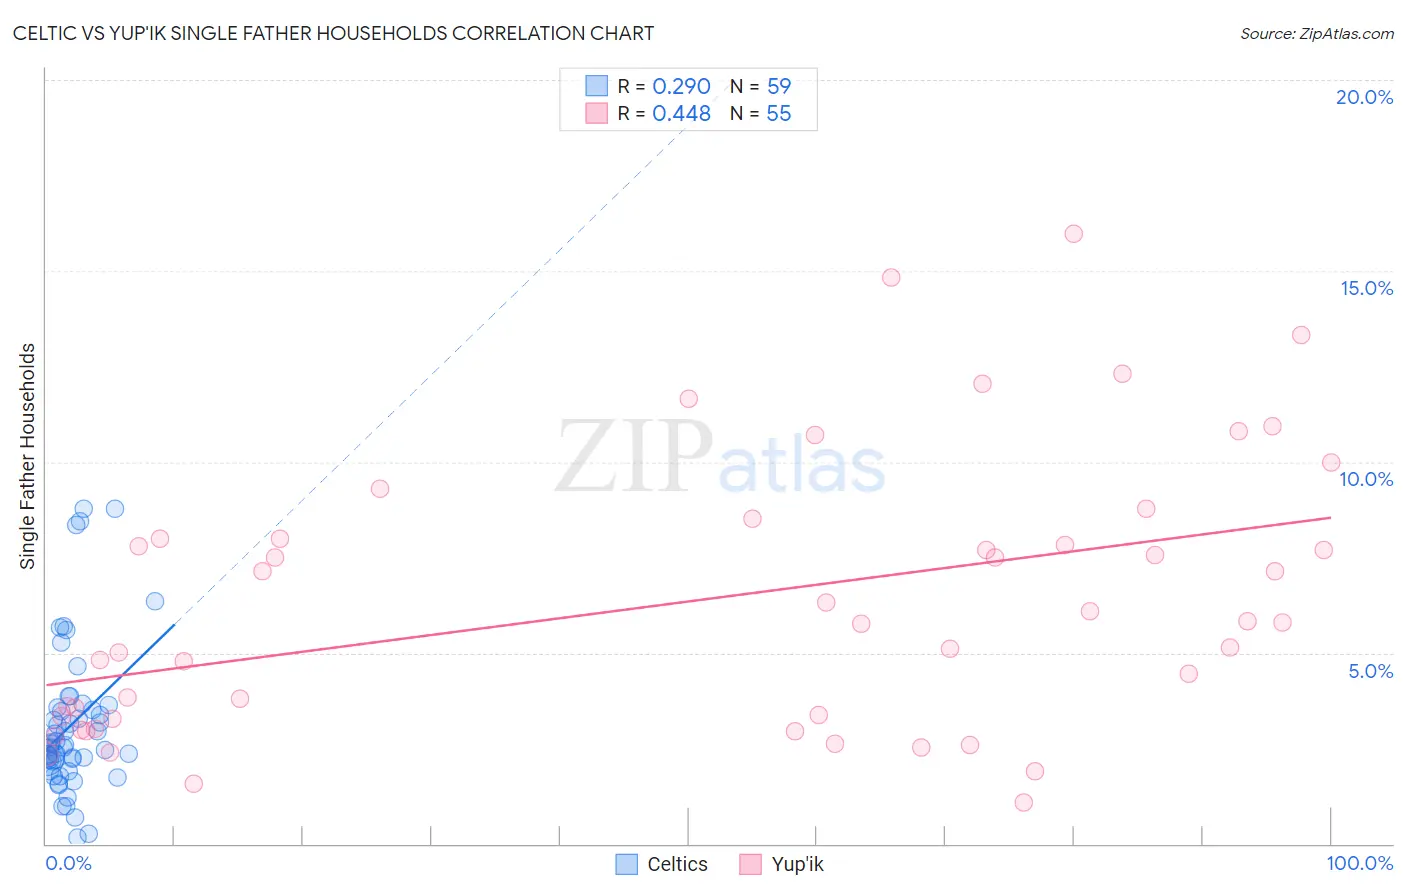
Celtic vs Yup'ik Single Father Households Correlation Chart
The statistical analysis conducted on geographies consisting of 168,269,233 people shows a weak positive correlation between the proportion of Celtics and percentage of single father households in the United States with a correlation coefficient (R) of 0.290 and weighted average of 2.3%. Similarly, the statistical analysis conducted on geographies consisting of 39,844,745 people shows a moderate positive correlation between the proportion of Yup'ik and percentage of single father households in the United States with a correlation coefficient (R) of 0.448 and weighted average of 5.4%, a difference of 131.2%.
Single Father Households Correlation Summary
| Measurement | Celtic | Yup'ik |
| Minimum | 0.17% | 1.1% |
| Maximum | 8.8% | 16.0% |
| Range | 8.6% | 14.9% |
| Mean | 3.1% | 6.3% |
| Median | 2.6% | 5.8% |
| Interquartile 25% (IQ1) | 2.2% | 3.3% |
| Interquartile 75% (IQ3) | 3.6% | 8.0% |
| Interquartile Range (IQR) | 1.4% | 4.7% |
| Standard Deviation (Sample) | 1.9% | 3.6% |
| Standard Deviation (Population) | 1.9% | 3.5% |
Similar Demographics by Single Father Households
Demographics Similar to Celtics by Single Father Households
In terms of single father households, the demographic groups most similar to Celtics are Czechoslovakian (2.3%, a difference of 0.26%), Afghan (2.3%, a difference of 0.40%), Swedish (2.3%, a difference of 0.47%), Immigrants from Jamaica (2.3%, a difference of 0.47%), and Ugandan (2.3%, a difference of 0.52%).
| Demographics | Rating | Rank | Single Father Households |
| English | 68.6 /100 | #166 | Good 2.3% |
| South Americans | 64.3 /100 | #167 | Good 2.3% |
| Icelanders | 63.1 /100 | #168 | Good 2.3% |
| Czechs | 62.5 /100 | #169 | Good 2.3% |
| Ugandans | 62.2 /100 | #170 | Good 2.3% |
| Swedes | 61.6 /100 | #171 | Good 2.3% |
| Czechoslovakians | 58.9 /100 | #172 | Average 2.3% |
| Celtics | 55.4 /100 | #173 | Average 2.3% |
| Afghans | 50.0 /100 | #174 | Average 2.3% |
| Immigrants | Jamaica | 49.1 /100 | #175 | Average 2.3% |
| Danes | 48.2 /100 | #176 | Average 2.3% |
| Colombians | 48.0 /100 | #177 | Average 2.3% |
| Costa Ricans | 44.1 /100 | #178 | Average 2.3% |
| Welsh | 44.0 /100 | #179 | Average 2.3% |
| Yugoslavians | 43.9 /100 | #180 | Average 2.3% |
Demographics Similar to Yup'ik by Single Father Households
In terms of single father households, the demographic groups most similar to Yup'ik are Inupiat (4.9%, a difference of 10.7%), Menominee (4.2%, a difference of 27.7%), Yakama (4.2%, a difference of 28.6%), Pima (4.2%, a difference of 28.9%), and Tohono O'odham (3.8%, a difference of 40.8%).
| Demographics | Rating | Rank | Single Father Households |
| Natives/Alaskans | 0.0 /100 | #333 | Tragic 3.2% |
| Yuman | 0.0 /100 | #334 | Tragic 3.3% |
| Colville | 0.0 /100 | #335 | Tragic 3.3% |
| Paiute | 0.0 /100 | #336 | Tragic 3.3% |
| Pueblo | 0.0 /100 | #337 | Tragic 3.3% |
| Sioux | 0.0 /100 | #338 | Tragic 3.3% |
| Alaskan Athabascans | 0.0 /100 | #339 | Tragic 3.4% |
| Alaska Natives | 0.0 /100 | #340 | Tragic 3.5% |
| Crow | 0.0 /100 | #341 | Tragic 3.5% |
| Tohono O'odham | 0.0 /100 | #342 | Tragic 3.8% |
| Pima | 0.0 /100 | #343 | Tragic 4.2% |
| Yakama | 0.0 /100 | #344 | Tragic 4.2% |
| Menominee | 0.0 /100 | #345 | Tragic 4.2% |
| Inupiat | 0.0 /100 | #346 | Tragic 4.9% |
| Yup'ik | 0.0 /100 | #347 | Tragic 5.4% |