Celtic vs Immigrants from Kuwait Single Father Households
COMPARE
Celtic
Immigrants from Kuwait
Single Father Households
Single Father Households Comparison
Celtics
Immigrants from Kuwait
2.3%
SINGLE FATHER HOUSEHOLDS
55.4/ 100
METRIC RATING
173rd/ 347
METRIC RANK
2.1%
SINGLE FATHER HOUSEHOLDS
99.8/ 100
METRIC RATING
71st/ 347
METRIC RANK
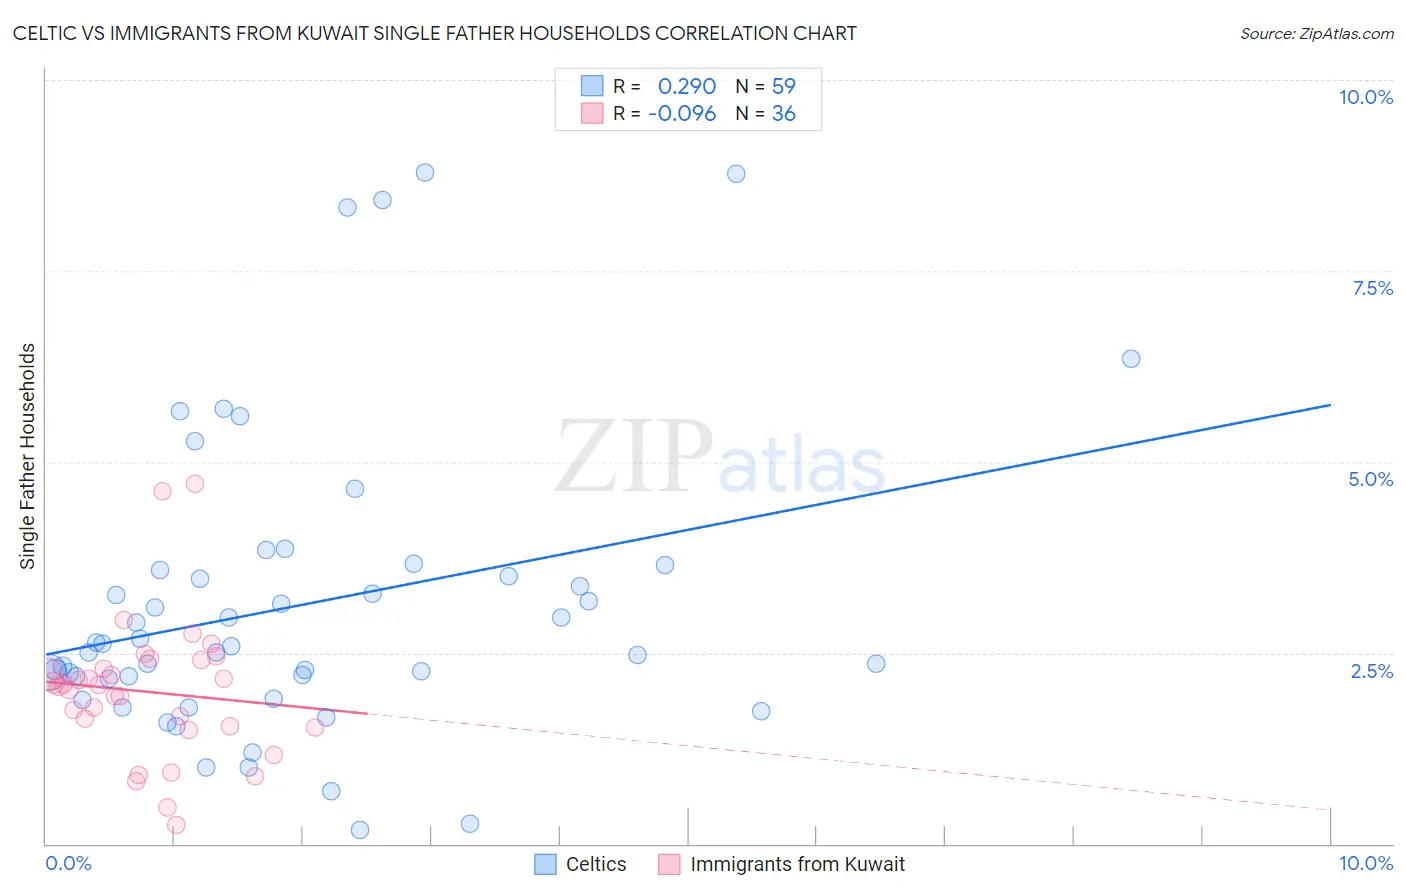
Celtic vs Immigrants from Kuwait Single Father Households Correlation Chart
The statistical analysis conducted on geographies consisting of 168,269,233 people shows a weak positive correlation between the proportion of Celtics and percentage of single father households in the United States with a correlation coefficient (R) of 0.290 and weighted average of 2.3%. Similarly, the statistical analysis conducted on geographies consisting of 136,715,758 people shows a slight negative correlation between the proportion of Immigrants from Kuwait and percentage of single father households in the United States with a correlation coefficient (R) of -0.096 and weighted average of 2.1%, a difference of 12.6%.
Single Father Households Correlation Summary
| Measurement | Celtic | Immigrants from Kuwait |
| Minimum | 0.17% | 0.25% |
| Maximum | 8.8% | 4.7% |
| Range | 8.6% | 4.5% |
| Mean | 3.1% | 2.0% |
| Median | 2.6% | 2.1% |
| Interquartile 25% (IQ1) | 2.2% | 1.5% |
| Interquartile 75% (IQ3) | 3.6% | 2.3% |
| Interquartile Range (IQR) | 1.4% | 0.82% |
| Standard Deviation (Sample) | 1.9% | 0.91% |
| Standard Deviation (Population) | 1.9% | 0.90% |
Similar Demographics by Single Father Households
Demographics Similar to Celtics by Single Father Households
In terms of single father households, the demographic groups most similar to Celtics are Czechoslovakian (2.3%, a difference of 0.26%), Afghan (2.3%, a difference of 0.40%), Swedish (2.3%, a difference of 0.47%), Immigrants from Jamaica (2.3%, a difference of 0.47%), and Ugandan (2.3%, a difference of 0.52%).
| Demographics | Rating | Rank | Single Father Households |
| English | 68.6 /100 | #166 | Good 2.3% |
| South Americans | 64.3 /100 | #167 | Good 2.3% |
| Icelanders | 63.1 /100 | #168 | Good 2.3% |
| Czechs | 62.5 /100 | #169 | Good 2.3% |
| Ugandans | 62.2 /100 | #170 | Good 2.3% |
| Swedes | 61.6 /100 | #171 | Good 2.3% |
| Czechoslovakians | 58.9 /100 | #172 | Average 2.3% |
| Celtics | 55.4 /100 | #173 | Average 2.3% |
| Afghans | 50.0 /100 | #174 | Average 2.3% |
| Immigrants | Jamaica | 49.1 /100 | #175 | Average 2.3% |
| Danes | 48.2 /100 | #176 | Average 2.3% |
| Colombians | 48.0 /100 | #177 | Average 2.3% |
| Costa Ricans | 44.1 /100 | #178 | Average 2.3% |
| Welsh | 44.0 /100 | #179 | Average 2.3% |
| Yugoslavians | 43.9 /100 | #180 | Average 2.3% |
Demographics Similar to Immigrants from Kuwait by Single Father Households
In terms of single father households, the demographic groups most similar to Immigrants from Kuwait are Immigrants from Spain (2.1%, a difference of 0.0%), Egyptian (2.1%, a difference of 0.010%), Immigrants from Bangladesh (2.1%, a difference of 0.15%), Immigrants from Egypt (2.1%, a difference of 0.15%), and Immigrants from Romania (2.1%, a difference of 0.22%).
| Demographics | Rating | Rank | Single Father Households |
| Mongolians | 99.9 /100 | #64 | Exceptional 2.1% |
| Paraguayans | 99.9 /100 | #65 | Exceptional 2.1% |
| Immigrants | Western Asia | 99.8 /100 | #66 | Exceptional 2.1% |
| Immigrants | Italy | 99.8 /100 | #67 | Exceptional 2.1% |
| Immigrants | Denmark | 99.8 /100 | #68 | Exceptional 2.1% |
| Immigrants | Romania | 99.8 /100 | #69 | Exceptional 2.1% |
| Egyptians | 99.8 /100 | #70 | Exceptional 2.1% |
| Immigrants | Kuwait | 99.8 /100 | #71 | Exceptional 2.1% |
| Immigrants | Spain | 99.8 /100 | #72 | Exceptional 2.1% |
| Immigrants | Bangladesh | 99.8 /100 | #73 | Exceptional 2.1% |
| Immigrants | Egypt | 99.8 /100 | #74 | Exceptional 2.1% |
| Immigrants | Sweden | 99.8 /100 | #75 | Exceptional 2.1% |
| Immigrants | Scotland | 99.8 /100 | #76 | Exceptional 2.1% |
| Immigrants | Saudi Arabia | 99.8 /100 | #77 | Exceptional 2.1% |
| Estonians | 99.7 /100 | #78 | Exceptional 2.1% |