Immigrants from Spain vs Hopi Single Mother Households
COMPARE
Immigrants from Spain
Hopi
Single Mother Households
Single Mother Households Comparison
Immigrants from Spain
Hopi
5.9%
SINGLE MOTHER HOUSEHOLDS
91.2/ 100
METRIC RATING
131st/ 347
METRIC RANK
8.5%
SINGLE MOTHER HOUSEHOLDS
0.0/ 100
METRIC RATING
329th/ 347
METRIC RANK
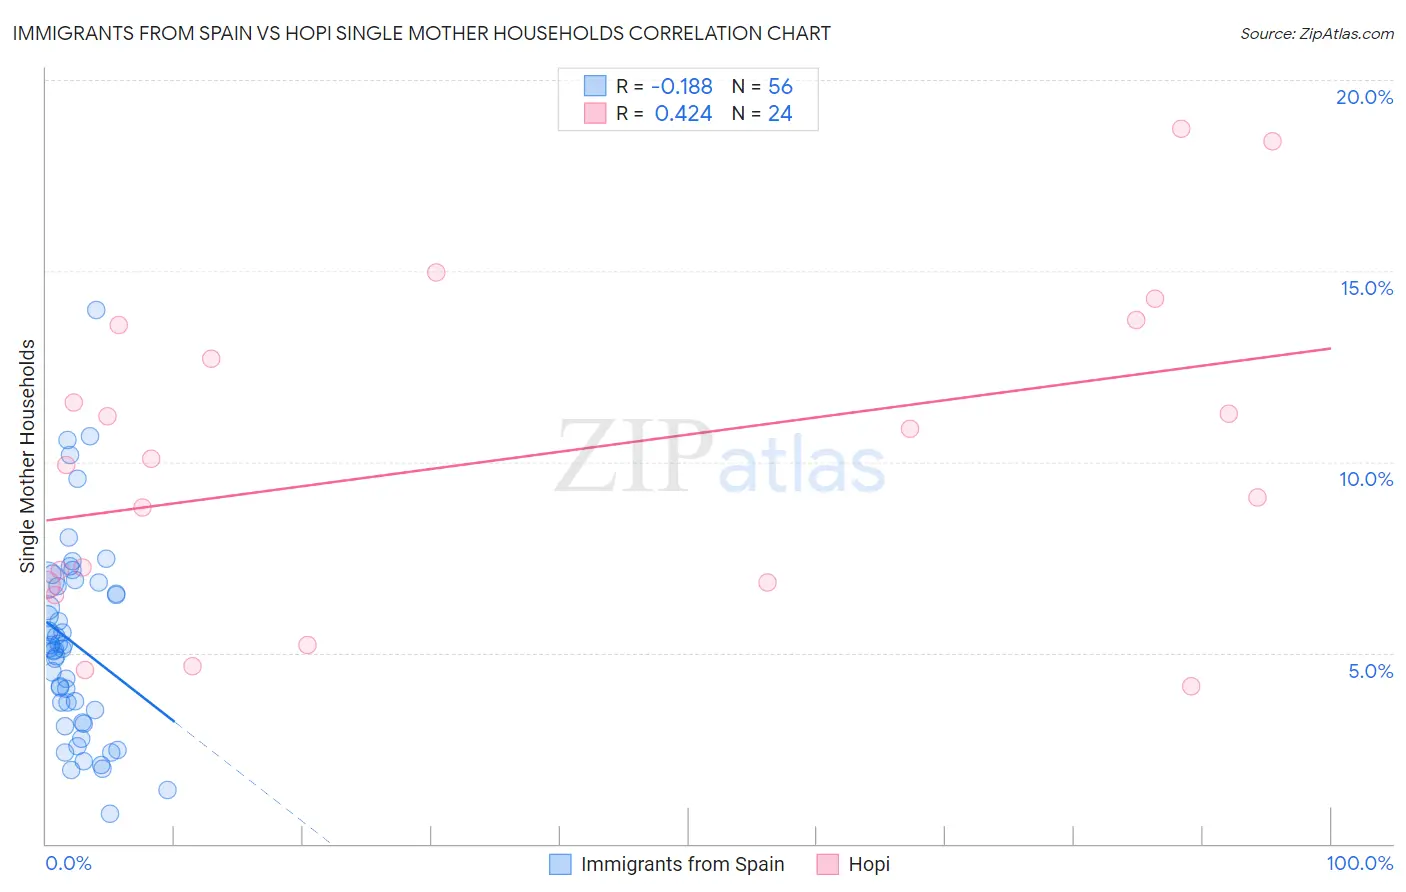
Immigrants from Spain vs Hopi Single Mother Households Correlation Chart
The statistical analysis conducted on geographies consisting of 239,327,015 people shows a poor negative correlation between the proportion of Immigrants from Spain and percentage of single mother households in the United States with a correlation coefficient (R) of -0.188 and weighted average of 5.9%. Similarly, the statistical analysis conducted on geographies consisting of 74,699,653 people shows a moderate positive correlation between the proportion of Hopi and percentage of single mother households in the United States with a correlation coefficient (R) of 0.424 and weighted average of 8.5%, a difference of 43.5%.
Single Mother Households Correlation Summary
| Measurement | Immigrants from Spain | Hopi |
| Minimum | 0.79% | 4.1% |
| Maximum | 14.0% | 18.7% |
| Range | 13.2% | 14.6% |
| Mean | 5.2% | 10.1% |
| Median | 5.1% | 10.0% |
| Interquartile 25% (IQ1) | 3.3% | 6.8% |
| Interquartile 75% (IQ3) | 6.8% | 13.1% |
| Interquartile Range (IQR) | 3.5% | 6.4% |
| Standard Deviation (Sample) | 2.6% | 4.2% |
| Standard Deviation (Population) | 2.5% | 4.1% |
Similar Demographics by Single Mother Households
Demographics Similar to Immigrants from Spain by Single Mother Households
In terms of single mother households, the demographic groups most similar to Immigrants from Spain are Albanian (5.9%, a difference of 0.040%), Egyptian (5.9%, a difference of 0.20%), Canadian (5.9%, a difference of 0.26%), Palestinian (5.9%, a difference of 0.35%), and Immigrants from Saudi Arabia (5.9%, a difference of 0.35%).
| Demographics | Rating | Rank | Single Mother Households |
| Immigrants | Argentina | 93.2 /100 | #124 | Exceptional 5.9% |
| Slavs | 92.9 /100 | #125 | Exceptional 5.9% |
| Welsh | 92.8 /100 | #126 | Exceptional 5.9% |
| Lebanese | 92.4 /100 | #127 | Exceptional 5.9% |
| Czechoslovakians | 92.2 /100 | #128 | Exceptional 5.9% |
| Immigrants | Bolivia | 92.2 /100 | #129 | Exceptional 5.9% |
| Palestinians | 92.1 /100 | #130 | Exceptional 5.9% |
| Immigrants | Spain | 91.2 /100 | #131 | Exceptional 5.9% |
| Albanians | 91.1 /100 | #132 | Exceptional 5.9% |
| Egyptians | 90.7 /100 | #133 | Exceptional 5.9% |
| Canadians | 90.5 /100 | #134 | Exceptional 5.9% |
| Immigrants | Saudi Arabia | 90.2 /100 | #135 | Exceptional 5.9% |
| Jordanians | 88.9 /100 | #136 | Excellent 6.0% |
| Immigrants | Pakistan | 88.4 /100 | #137 | Excellent 6.0% |
| Icelanders | 86.9 /100 | #138 | Excellent 6.0% |
Demographics Similar to Hopi by Single Mother Households
In terms of single mother households, the demographic groups most similar to Hopi are Inupiat (8.5%, a difference of 0.11%), Sioux (8.5%, a difference of 0.11%), Yakama (8.4%, a difference of 0.75%), Immigrants from Haiti (8.4%, a difference of 0.92%), and British West Indian (8.4%, a difference of 1.1%).
| Demographics | Rating | Rank | Single Mother Households |
| Pima | 0.0 /100 | #322 | Tragic 8.3% |
| Haitians | 0.0 /100 | #323 | Tragic 8.3% |
| Immigrants | Jamaica | 0.0 /100 | #324 | Tragic 8.4% |
| Immigrants | Caribbean | 0.0 /100 | #325 | Tragic 8.4% |
| British West Indians | 0.0 /100 | #326 | Tragic 8.4% |
| Immigrants | Haiti | 0.0 /100 | #327 | Tragic 8.4% |
| Yakama | 0.0 /100 | #328 | Tragic 8.4% |
| Hopi | 0.0 /100 | #329 | Tragic 8.5% |
| Inupiat | 0.0 /100 | #330 | Tragic 8.5% |
| Sioux | 0.0 /100 | #331 | Tragic 8.5% |
| U.S. Virgin Islanders | 0.0 /100 | #332 | Tragic 8.6% |
| Liberians | 0.0 /100 | #333 | Tragic 8.6% |
| Immigrants | Liberia | 0.0 /100 | #334 | Tragic 8.7% |
| Immigrants | Dominica | 0.0 /100 | #335 | Tragic 8.7% |
| Puerto Ricans | 0.0 /100 | #336 | Tragic 8.7% |