Trinidadian and Tobagonian vs Hopi Single Mother Households
COMPARE
Trinidadian and Tobagonian
Hopi
Single Mother Households
Single Mother Households Comparison
Trinidadians and Tobagonians
Hopi
7.7%
SINGLE MOTHER HOUSEHOLDS
0.0/ 100
METRIC RATING
285th/ 347
METRIC RANK
8.5%
SINGLE MOTHER HOUSEHOLDS
0.0/ 100
METRIC RATING
329th/ 347
METRIC RANK
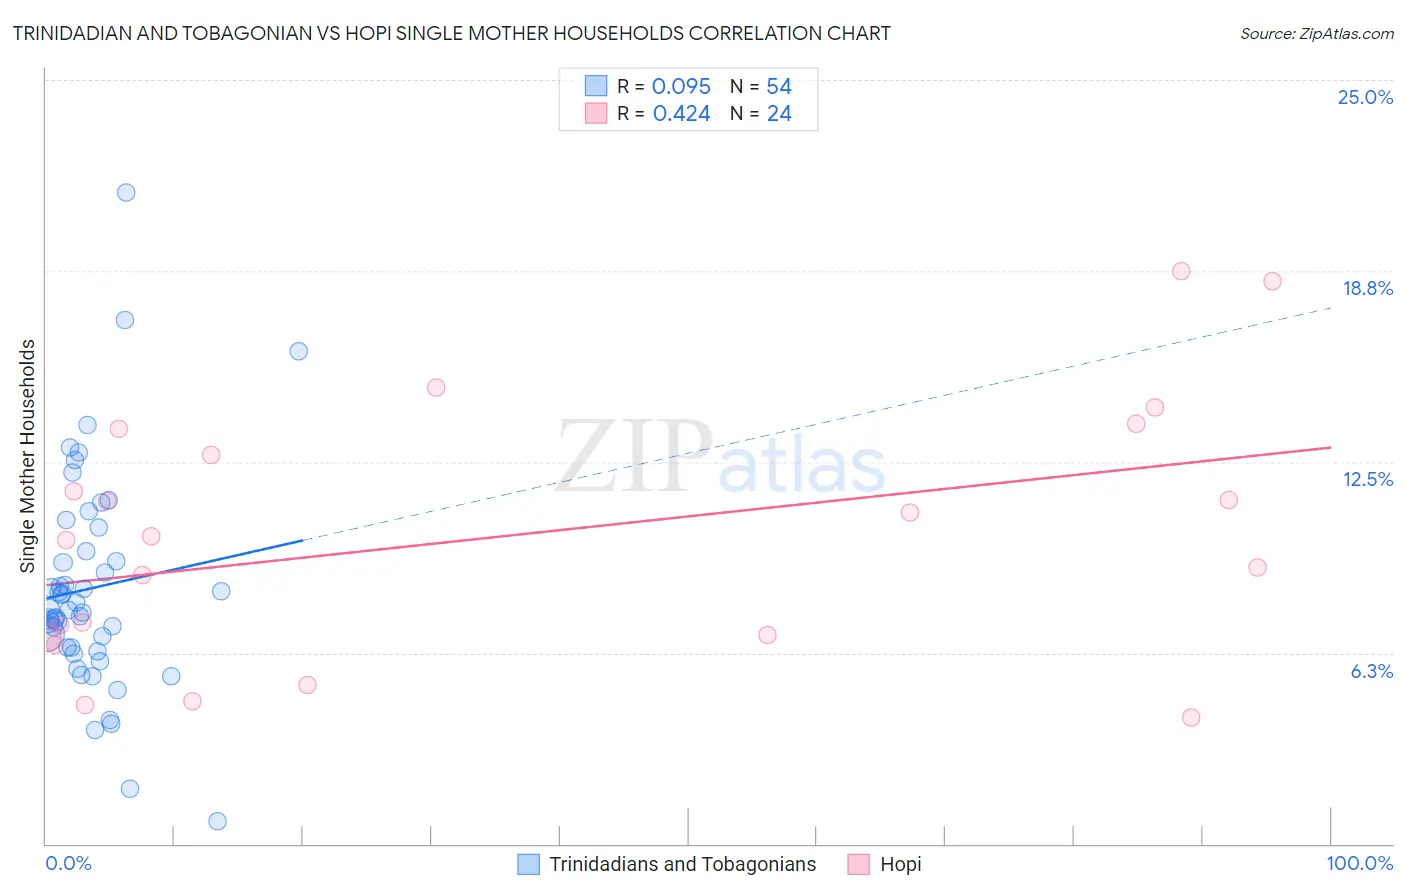
Trinidadian and Tobagonian vs Hopi Single Mother Households Correlation Chart
The statistical analysis conducted on geographies consisting of 219,557,612 people shows a slight positive correlation between the proportion of Trinidadians and Tobagonians and percentage of single mother households in the United States with a correlation coefficient (R) of 0.095 and weighted average of 7.7%. Similarly, the statistical analysis conducted on geographies consisting of 74,699,653 people shows a moderate positive correlation between the proportion of Hopi and percentage of single mother households in the United States with a correlation coefficient (R) of 0.424 and weighted average of 8.5%, a difference of 9.9%.
Single Mother Households Correlation Summary
| Measurement | Trinidadian and Tobagonian | Hopi |
| Minimum | 0.73% | 4.1% |
| Maximum | 21.3% | 18.7% |
| Range | 20.6% | 14.6% |
| Mean | 8.4% | 10.1% |
| Median | 7.7% | 10.0% |
| Interquartile 25% (IQ1) | 6.4% | 6.8% |
| Interquartile 75% (IQ3) | 9.6% | 13.1% |
| Interquartile Range (IQR) | 3.2% | 6.4% |
| Standard Deviation (Sample) | 3.6% | 4.2% |
| Standard Deviation (Population) | 3.6% | 4.1% |
Similar Demographics by Single Mother Households
Demographics Similar to Trinidadians and Tobagonians by Single Mother Households
In terms of single mother households, the demographic groups most similar to Trinidadians and Tobagonians are Immigrants from Belize (7.7%, a difference of 0.030%), Immigrants from Middle Africa (7.7%, a difference of 0.11%), Immigrants from Guatemala (7.7%, a difference of 0.21%), Sierra Leonean (7.7%, a difference of 0.26%), and Nigerian (7.7%, a difference of 0.63%).
| Demographics | Rating | Rank | Single Mother Households |
| Central Americans | 0.1 /100 | #278 | Tragic 7.6% |
| Immigrants | El Salvador | 0.0 /100 | #279 | Tragic 7.6% |
| Immigrants | Sierra Leone | 0.0 /100 | #280 | Tragic 7.7% |
| Immigrants | Laos | 0.0 /100 | #281 | Tragic 7.7% |
| Guatemalans | 0.0 /100 | #282 | Tragic 7.7% |
| Nigerians | 0.0 /100 | #283 | Tragic 7.7% |
| Immigrants | Belize | 0.0 /100 | #284 | Tragic 7.7% |
| Trinidadians and Tobagonians | 0.0 /100 | #285 | Tragic 7.7% |
| Immigrants | Middle Africa | 0.0 /100 | #286 | Tragic 7.7% |
| Immigrants | Guatemala | 0.0 /100 | #287 | Tragic 7.7% |
| Sierra Leoneans | 0.0 /100 | #288 | Tragic 7.7% |
| Sub-Saharan Africans | 0.0 /100 | #289 | Tragic 7.8% |
| Immigrants | Nigeria | 0.0 /100 | #290 | Tragic 7.8% |
| West Indians | 0.0 /100 | #291 | Tragic 7.8% |
| Ghanaians | 0.0 /100 | #292 | Tragic 7.8% |
Demographics Similar to Hopi by Single Mother Households
In terms of single mother households, the demographic groups most similar to Hopi are Inupiat (8.5%, a difference of 0.11%), Sioux (8.5%, a difference of 0.11%), Yakama (8.4%, a difference of 0.75%), Immigrants from Haiti (8.4%, a difference of 0.92%), and British West Indian (8.4%, a difference of 1.1%).
| Demographics | Rating | Rank | Single Mother Households |
| Pima | 0.0 /100 | #322 | Tragic 8.3% |
| Haitians | 0.0 /100 | #323 | Tragic 8.3% |
| Immigrants | Jamaica | 0.0 /100 | #324 | Tragic 8.4% |
| Immigrants | Caribbean | 0.0 /100 | #325 | Tragic 8.4% |
| British West Indians | 0.0 /100 | #326 | Tragic 8.4% |
| Immigrants | Haiti | 0.0 /100 | #327 | Tragic 8.4% |
| Yakama | 0.0 /100 | #328 | Tragic 8.4% |
| Hopi | 0.0 /100 | #329 | Tragic 8.5% |
| Inupiat | 0.0 /100 | #330 | Tragic 8.5% |
| Sioux | 0.0 /100 | #331 | Tragic 8.5% |
| U.S. Virgin Islanders | 0.0 /100 | #332 | Tragic 8.6% |
| Liberians | 0.0 /100 | #333 | Tragic 8.6% |
| Immigrants | Liberia | 0.0 /100 | #334 | Tragic 8.7% |
| Immigrants | Dominica | 0.0 /100 | #335 | Tragic 8.7% |
| Puerto Ricans | 0.0 /100 | #336 | Tragic 8.7% |