Immigrants from the Azores vs Hopi Single Mother Households
COMPARE
Immigrants from the Azores
Hopi
Single Mother Households
Single Mother Households Comparison
Immigrants from the Azores
Hopi
7.5%
SINGLE MOTHER HOUSEHOLDS
0.1/ 100
METRIC RATING
272nd/ 347
METRIC RANK
8.5%
SINGLE MOTHER HOUSEHOLDS
0.0/ 100
METRIC RATING
329th/ 347
METRIC RANK
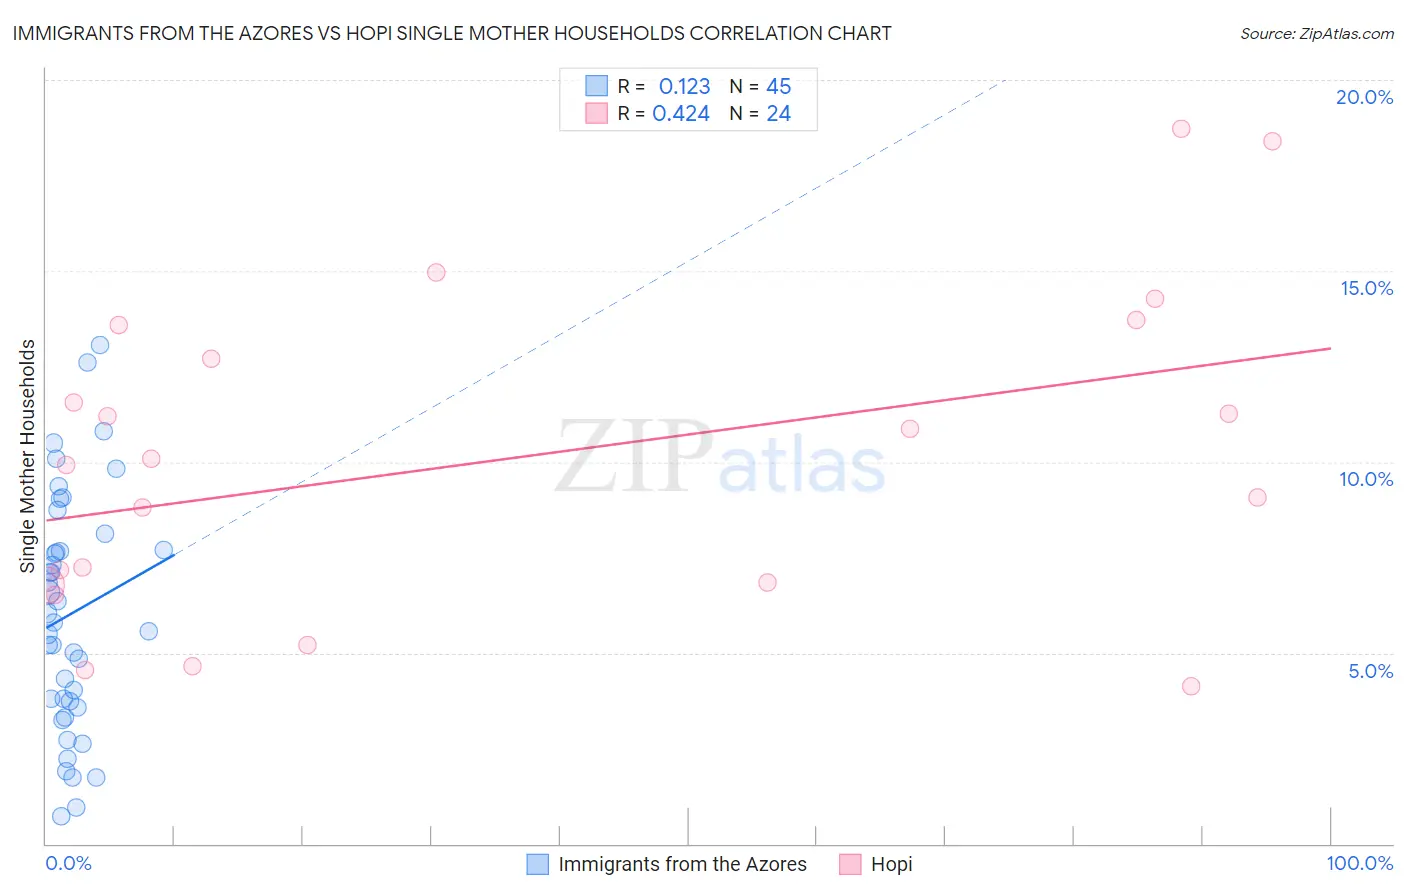
Immigrants from the Azores vs Hopi Single Mother Households Correlation Chart
The statistical analysis conducted on geographies consisting of 46,218,711 people shows a poor positive correlation between the proportion of Immigrants from the Azores and percentage of single mother households in the United States with a correlation coefficient (R) of 0.123 and weighted average of 7.5%. Similarly, the statistical analysis conducted on geographies consisting of 74,699,653 people shows a moderate positive correlation between the proportion of Hopi and percentage of single mother households in the United States with a correlation coefficient (R) of 0.424 and weighted average of 8.5%, a difference of 12.5%.
Single Mother Households Correlation Summary
| Measurement | Immigrants from the Azores | Hopi |
| Minimum | 0.74% | 4.1% |
| Maximum | 13.1% | 18.7% |
| Range | 12.3% | 14.6% |
| Mean | 6.0% | 10.1% |
| Median | 5.8% | 10.0% |
| Interquartile 25% (IQ1) | 3.6% | 6.8% |
| Interquartile 75% (IQ3) | 7.9% | 13.1% |
| Interquartile Range (IQR) | 4.3% | 6.4% |
| Standard Deviation (Sample) | 3.1% | 4.2% |
| Standard Deviation (Population) | 3.0% | 4.1% |
Similar Demographics by Single Mother Households
Demographics Similar to Immigrants from the Azores by Single Mother Households
In terms of single mother households, the demographic groups most similar to Immigrants from the Azores are Salvadoran (7.5%, a difference of 0.0%), Immigrants from Cuba (7.5%, a difference of 0.090%), Somali (7.5%, a difference of 0.25%), Belizean (7.6%, a difference of 0.31%), and Immigrants from Guyana (7.6%, a difference of 0.36%).
| Demographics | Rating | Rank | Single Mother Households |
| Crow | 0.1 /100 | #265 | Tragic 7.4% |
| Nepalese | 0.1 /100 | #266 | Tragic 7.5% |
| Blackfeet | 0.1 /100 | #267 | Tragic 7.5% |
| Indonesians | 0.1 /100 | #268 | Tragic 7.5% |
| Somalis | 0.1 /100 | #269 | Tragic 7.5% |
| Immigrants | Cuba | 0.1 /100 | #270 | Tragic 7.5% |
| Salvadorans | 0.1 /100 | #271 | Tragic 7.5% |
| Immigrants | Azores | 0.1 /100 | #272 | Tragic 7.5% |
| Belizeans | 0.1 /100 | #273 | Tragic 7.6% |
| Immigrants | Guyana | 0.1 /100 | #274 | Tragic 7.6% |
| Central American Indians | 0.1 /100 | #275 | Tragic 7.6% |
| Guyanese | 0.1 /100 | #276 | Tragic 7.6% |
| Immigrants | Trinidad and Tobago | 0.1 /100 | #277 | Tragic 7.6% |
| Central Americans | 0.1 /100 | #278 | Tragic 7.6% |
| Immigrants | El Salvador | 0.0 /100 | #279 | Tragic 7.6% |
Demographics Similar to Hopi by Single Mother Households
In terms of single mother households, the demographic groups most similar to Hopi are Inupiat (8.5%, a difference of 0.11%), Sioux (8.5%, a difference of 0.11%), Yakama (8.4%, a difference of 0.75%), Immigrants from Haiti (8.4%, a difference of 0.92%), and British West Indian (8.4%, a difference of 1.1%).
| Demographics | Rating | Rank | Single Mother Households |
| Pima | 0.0 /100 | #322 | Tragic 8.3% |
| Haitians | 0.0 /100 | #323 | Tragic 8.3% |
| Immigrants | Jamaica | 0.0 /100 | #324 | Tragic 8.4% |
| Immigrants | Caribbean | 0.0 /100 | #325 | Tragic 8.4% |
| British West Indians | 0.0 /100 | #326 | Tragic 8.4% |
| Immigrants | Haiti | 0.0 /100 | #327 | Tragic 8.4% |
| Yakama | 0.0 /100 | #328 | Tragic 8.4% |
| Hopi | 0.0 /100 | #329 | Tragic 8.5% |
| Inupiat | 0.0 /100 | #330 | Tragic 8.5% |
| Sioux | 0.0 /100 | #331 | Tragic 8.5% |
| U.S. Virgin Islanders | 0.0 /100 | #332 | Tragic 8.6% |
| Liberians | 0.0 /100 | #333 | Tragic 8.6% |
| Immigrants | Liberia | 0.0 /100 | #334 | Tragic 8.7% |
| Immigrants | Dominica | 0.0 /100 | #335 | Tragic 8.7% |
| Puerto Ricans | 0.0 /100 | #336 | Tragic 8.7% |