Celtic vs Marshallese Single Mother Households
COMPARE
Celtic
Marshallese
Single Mother Households
Single Mother Households Comparison
Celtics
Marshallese
6.1%
SINGLE MOTHER HOUSEHOLDS
73.3/ 100
METRIC RATING
158th/ 347
METRIC RANK
6.3%
SINGLE MOTHER HOUSEHOLDS
45.8/ 100
METRIC RATING
175th/ 347
METRIC RANK
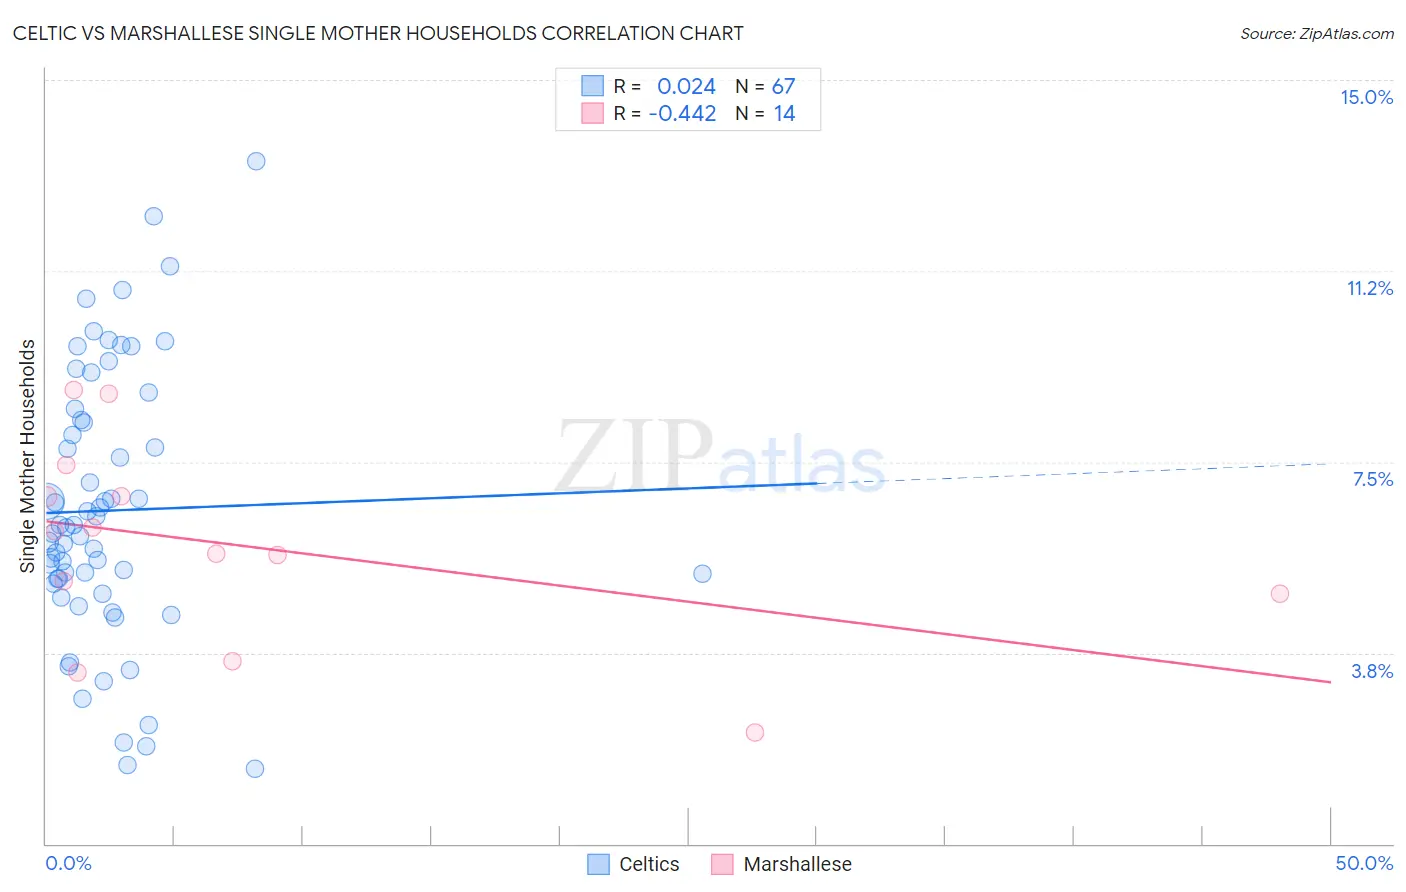
Celtic vs Marshallese Single Mother Households Correlation Chart
The statistical analysis conducted on geographies consisting of 168,688,619 people shows no correlation between the proportion of Celtics and percentage of single mother households in the United States with a correlation coefficient (R) of 0.024 and weighted average of 6.1%. Similarly, the statistical analysis conducted on geographies consisting of 14,758,592 people shows a moderate negative correlation between the proportion of Marshallese and percentage of single mother households in the United States with a correlation coefficient (R) of -0.442 and weighted average of 6.3%, a difference of 3.3%.
Single Mother Households Correlation Summary
| Measurement | Celtic | Marshallese |
| Minimum | 1.5% | 2.2% |
| Maximum | 13.4% | 8.9% |
| Range | 11.9% | 6.7% |
| Mean | 6.5% | 5.8% |
| Median | 6.2% | 5.9% |
| Interquartile 25% (IQ1) | 5.1% | 4.9% |
| Interquartile 75% (IQ3) | 8.3% | 6.8% |
| Interquartile Range (IQR) | 3.2% | 1.9% |
| Standard Deviation (Sample) | 2.6% | 1.9% |
| Standard Deviation (Population) | 2.6% | 1.9% |
Demographics Similar to Celtics and Marshallese by Single Mother Households
In terms of single mother households, the demographic groups most similar to Celtics are Yugoslavian (6.1%, a difference of 0.040%), Iraqi (6.1%, a difference of 0.050%), Chilean (6.1%, a difference of 0.13%), Immigrants from Germany (6.1%, a difference of 0.13%), and Native Hawaiian (6.1%, a difference of 0.24%). Similarly, the demographic groups most similar to Marshallese are Immigrants from Bosnia and Herzegovina (6.3%, a difference of 0.16%), Immigrants from Morocco (6.3%, a difference of 0.46%), Immigrants from Vietnam (6.3%, a difference of 0.63%), Immigrants from South Eastern Asia (6.3%, a difference of 0.70%), and Afghan (6.3%, a difference of 0.74%).
| Demographics | Rating | Rank | Single Mother Households |
| Native Hawaiians | 75.0 /100 | #156 | Good 6.1% |
| Chileans | 74.2 /100 | #157 | Good 6.1% |
| Celtics | 73.3 /100 | #158 | Good 6.1% |
| Yugoslavians | 73.1 /100 | #159 | Good 6.1% |
| Iraqis | 73.0 /100 | #160 | Good 6.1% |
| Immigrants | Germany | 72.4 /100 | #161 | Good 6.1% |
| Immigrants | Zimbabwe | 69.9 /100 | #162 | Good 6.2% |
| Alsatians | 68.7 /100 | #163 | Good 6.2% |
| Immigrants | Northern Africa | 68.0 /100 | #164 | Good 6.2% |
| Immigrants | Syria | 67.4 /100 | #165 | Good 6.2% |
| Sri Lankans | 63.9 /100 | #166 | Good 6.2% |
| Brazilians | 59.1 /100 | #167 | Average 6.2% |
| Immigrants | Chile | 58.3 /100 | #168 | Average 6.3% |
| Puget Sound Salish | 58.1 /100 | #169 | Average 6.3% |
| Immigrants | Oceania | 54.6 /100 | #170 | Average 6.3% |
| Afghans | 52.5 /100 | #171 | Average 6.3% |
| Immigrants | South Eastern Asia | 52.2 /100 | #172 | Average 6.3% |
| Immigrants | Vietnam | 51.5 /100 | #173 | Average 6.3% |
| Immigrants | Morocco | 50.0 /100 | #174 | Average 6.3% |
| Marshallese | 45.8 /100 | #175 | Average 6.3% |
| Immigrants | Bosnia and Herzegovina | 44.3 /100 | #176 | Average 6.3% |