Australian vs Immigrants from Albania Married-couple Households
COMPARE
Australian
Immigrants from Albania
Married-couple Households
Married-couple Households Comparison
Australians
Immigrants from Albania
47.4%
MARRIED-COUPLE HOUSEHOLDS
89.0/ 100
METRIC RATING
125th/ 347
METRIC RANK
44.4%
MARRIED-COUPLE HOUSEHOLDS
1.0/ 100
METRIC RATING
242nd/ 347
METRIC RANK
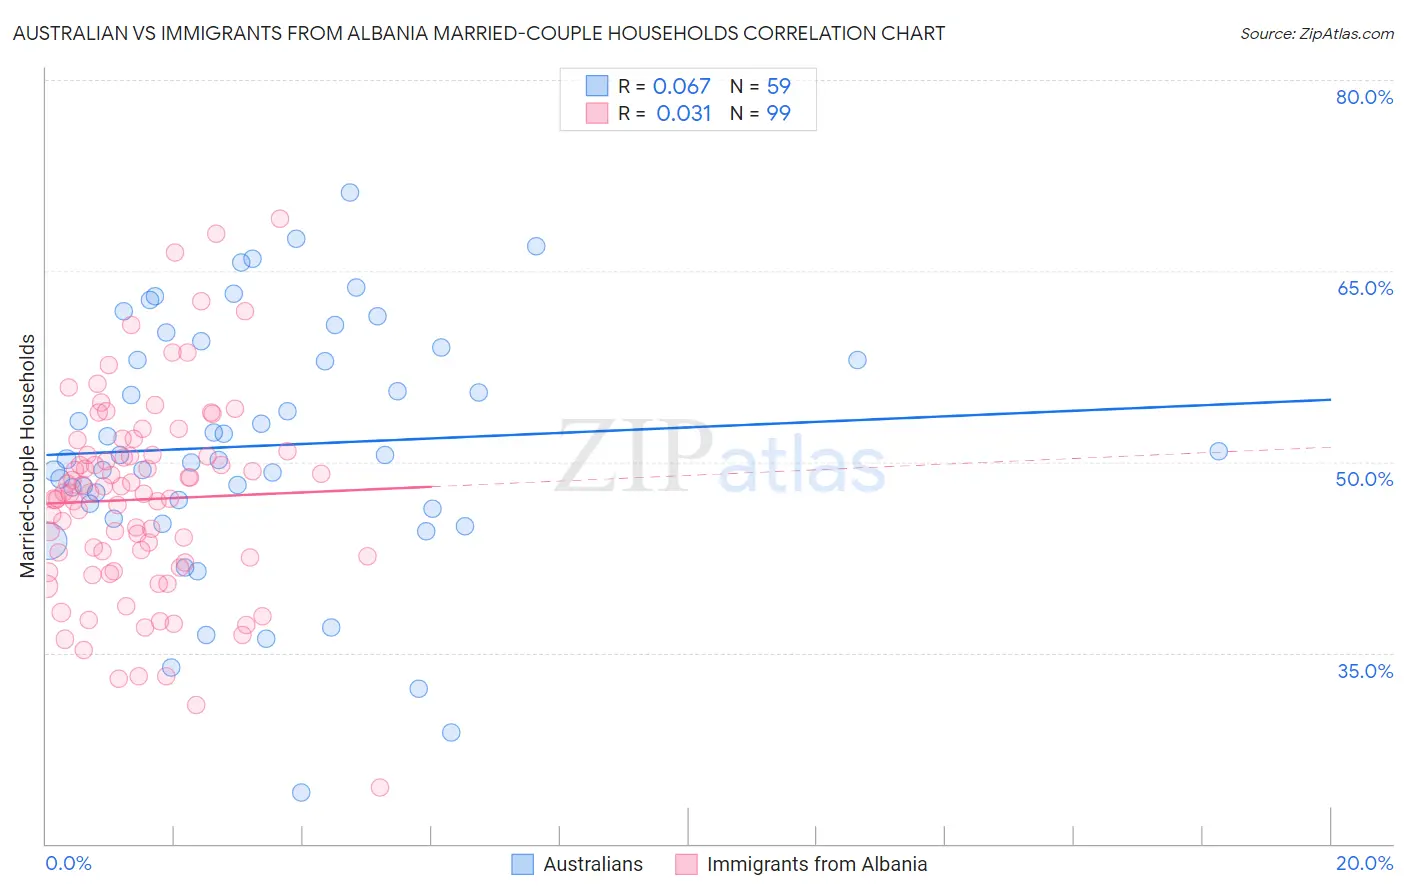
Australian vs Immigrants from Albania Married-couple Households Correlation Chart
The statistical analysis conducted on geographies consisting of 224,029,086 people shows a slight positive correlation between the proportion of Australians and percentage of married-couple family households in the United States with a correlation coefficient (R) of 0.067 and weighted average of 47.4%. Similarly, the statistical analysis conducted on geographies consisting of 119,383,494 people shows no correlation between the proportion of Immigrants from Albania and percentage of married-couple family households in the United States with a correlation coefficient (R) of 0.031 and weighted average of 44.4%, a difference of 6.6%.
Married-couple Households Correlation Summary
| Measurement | Australian | Immigrants from Albania |
| Minimum | 24.0% | 24.4% |
| Maximum | 71.2% | 69.1% |
| Range | 47.2% | 44.7% |
| Mean | 51.3% | 47.0% |
| Median | 50.6% | 47.6% |
| Interquartile 25% (IQ1) | 46.3% | 42.1% |
| Interquartile 75% (IQ3) | 59.0% | 50.5% |
| Interquartile Range (IQR) | 12.7% | 8.4% |
| Standard Deviation (Sample) | 9.9% | 7.9% |
| Standard Deviation (Population) | 9.9% | 7.8% |
Similar Demographics by Married-couple Households
Demographics Similar to Australians by Married-couple Households
In terms of married-couple households, the demographic groups most similar to Australians are Zimbabwean (47.4%, a difference of 0.020%), Immigrants from Venezuela (47.4%, a difference of 0.030%), Pakistani (47.3%, a difference of 0.030%), Celtic (47.3%, a difference of 0.080%), and Immigrants from Peru (47.3%, a difference of 0.10%).
| Demographics | Rating | Rank | Married-couple Households |
| Immigrants | Germany | 92.4 /100 | #118 | Exceptional 47.5% |
| Chileans | 92.2 /100 | #119 | Exceptional 47.5% |
| Puget Sound Salish | 90.5 /100 | #120 | Exceptional 47.4% |
| Immigrants | Eastern Europe | 90.3 /100 | #121 | Exceptional 47.4% |
| Okinawans | 90.1 /100 | #122 | Exceptional 47.4% |
| Immigrants | Venezuela | 89.3 /100 | #123 | Excellent 47.4% |
| Zimbabweans | 89.2 /100 | #124 | Excellent 47.4% |
| Australians | 89.0 /100 | #125 | Excellent 47.4% |
| Pakistanis | 88.6 /100 | #126 | Excellent 47.3% |
| Celtics | 88.1 /100 | #127 | Excellent 47.3% |
| Immigrants | Peru | 87.9 /100 | #128 | Excellent 47.3% |
| Immigrants | Iraq | 87.8 /100 | #129 | Excellent 47.3% |
| Immigrants | Hungary | 87.8 /100 | #130 | Excellent 47.3% |
| Immigrants | Denmark | 87.5 /100 | #131 | Excellent 47.3% |
| Immigrants | Ukraine | 86.7 /100 | #132 | Excellent 47.3% |
Demographics Similar to Immigrants from Albania by Married-couple Households
In terms of married-couple households, the demographic groups most similar to Immigrants from Albania are Ute (44.4%, a difference of 0.040%), Immigrants from Bosnia and Herzegovina (44.4%, a difference of 0.040%), Immigrants from Saudi Arabia (44.4%, a difference of 0.070%), Spanish American (44.5%, a difference of 0.12%), and Immigrants from Uruguay (44.5%, a difference of 0.14%).
| Demographics | Rating | Rank | Married-couple Households |
| Immigrants | Nicaragua | 1.2 /100 | #235 | Tragic 44.5% |
| Yaqui | 1.2 /100 | #236 | Tragic 44.5% |
| Comanche | 1.2 /100 | #237 | Tragic 44.5% |
| Immigrants | Uruguay | 1.1 /100 | #238 | Tragic 44.5% |
| Spanish Americans | 1.1 /100 | #239 | Tragic 44.5% |
| Ute | 1.0 /100 | #240 | Tragic 44.4% |
| Immigrants | Bosnia and Herzegovina | 1.0 /100 | #241 | Tragic 44.4% |
| Immigrants | Albania | 1.0 /100 | #242 | Tragic 44.4% |
| Immigrants | Saudi Arabia | 0.9 /100 | #243 | Tragic 44.4% |
| Immigrants | Armenia | 0.7 /100 | #244 | Tragic 44.3% |
| Immigrants | El Salvador | 0.7 /100 | #245 | Tragic 44.3% |
| Immigrants | Cuba | 0.6 /100 | #246 | Tragic 44.2% |
| Immigrants | Morocco | 0.6 /100 | #247 | Tragic 44.2% |
| Yup'ik | 0.4 /100 | #248 | Tragic 44.1% |
| Immigrants | Kenya | 0.4 /100 | #249 | Tragic 44.1% |