European vs Immigrants from Sierra Leone Currently Married
COMPARE
European
Immigrants from Sierra Leone
Currently Married
Currently Married Comparison
Europeans
Immigrants from Sierra Leone
49.3%
CURRENTLY MARRIED
99.8/ 100
METRIC RATING
19th/ 347
METRIC RANK
43.8%
CURRENTLY MARRIED
0.1/ 100
METRIC RATING
259th/ 347
METRIC RANK
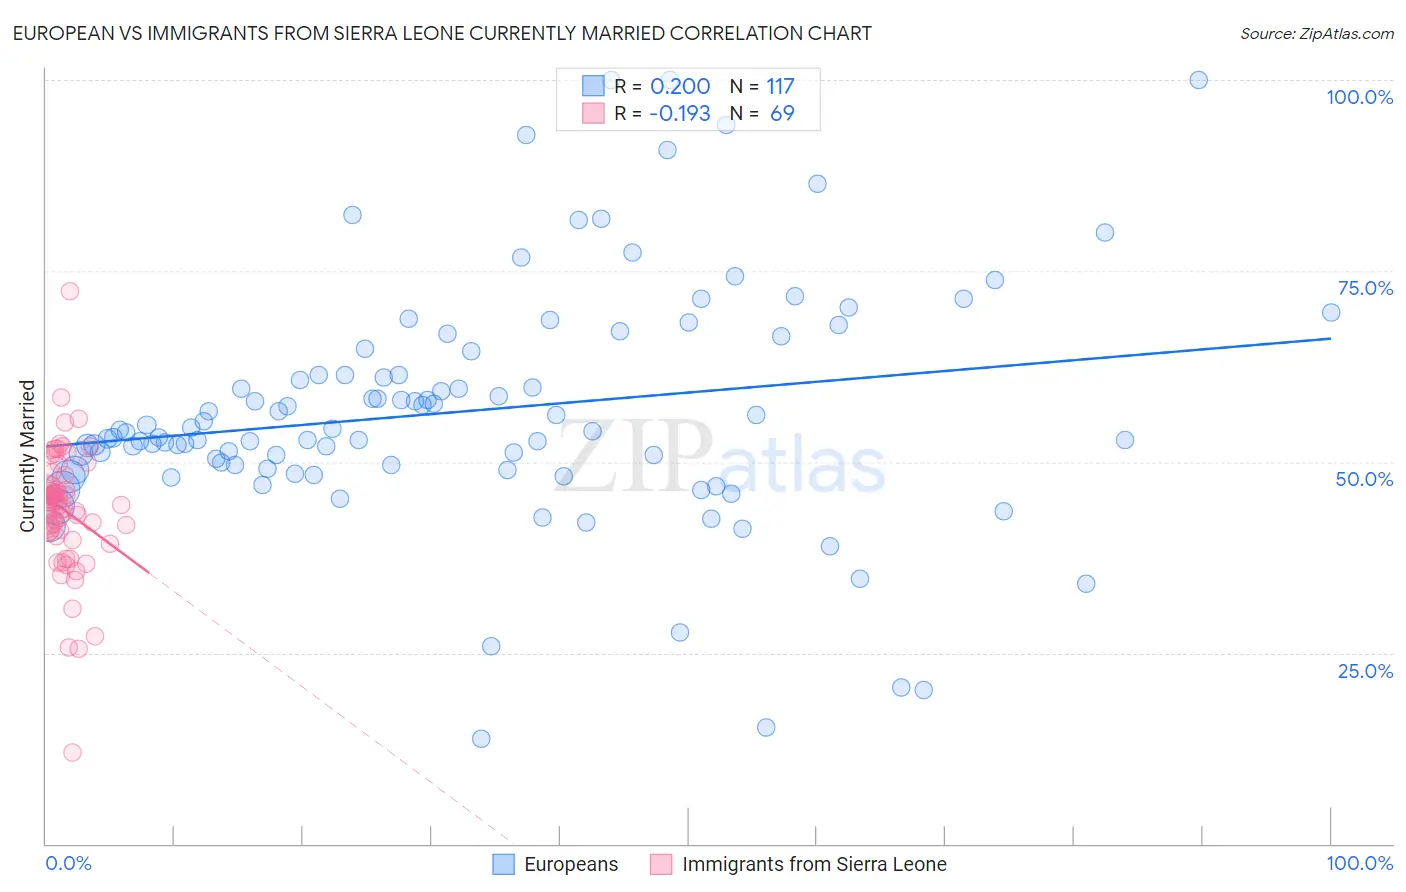
European vs Immigrants from Sierra Leone Currently Married Correlation Chart
The statistical analysis conducted on geographies consisting of 561,708,680 people shows a poor positive correlation between the proportion of Europeans and percentage of population currently married in the United States with a correlation coefficient (R) of 0.200 and weighted average of 49.3%. Similarly, the statistical analysis conducted on geographies consisting of 101,652,138 people shows a poor negative correlation between the proportion of Immigrants from Sierra Leone and percentage of population currently married in the United States with a correlation coefficient (R) of -0.193 and weighted average of 43.8%, a difference of 12.7%.
Currently Married Correlation Summary
| Measurement | European | Immigrants from Sierra Leone |
| Minimum | 13.8% | 12.0% |
| Maximum | 100.0% | 72.3% |
| Range | 86.2% | 60.3% |
| Mean | 56.7% | 43.7% |
| Median | 53.8% | 44.4% |
| Interquartile 25% (IQ1) | 49.0% | 40.5% |
| Interquartile 75% (IQ3) | 62.9% | 47.7% |
| Interquartile Range (IQR) | 13.9% | 7.1% |
| Standard Deviation (Sample) | 15.8% | 8.4% |
| Standard Deviation (Population) | 15.7% | 8.3% |
Similar Demographics by Currently Married
Demographics Similar to Europeans by Currently Married
In terms of currently married, the demographic groups most similar to Europeans are Immigrants from Scotland (49.3%, a difference of 0.020%), Luxembourger (49.3%, a difference of 0.14%), Scottish (49.2%, a difference of 0.24%), Scandinavian (49.5%, a difference of 0.31%), and Chinese (49.5%, a difference of 0.33%).
| Demographics | Rating | Rank | Currently Married |
| Swiss | 99.9 /100 | #12 | Exceptional 49.7% |
| Dutch | 99.9 /100 | #13 | Exceptional 49.6% |
| Germans | 99.9 /100 | #14 | Exceptional 49.6% |
| Pennsylvania Germans | 99.9 /100 | #15 | Exceptional 49.6% |
| Chinese | 99.9 /100 | #16 | Exceptional 49.5% |
| Scandinavians | 99.9 /100 | #17 | Exceptional 49.5% |
| Immigrants | Scotland | 99.8 /100 | #18 | Exceptional 49.3% |
| Europeans | 99.8 /100 | #19 | Exceptional 49.3% |
| Luxembourgers | 99.8 /100 | #20 | Exceptional 49.3% |
| Scottish | 99.8 /100 | #21 | Exceptional 49.2% |
| Bulgarians | 99.7 /100 | #22 | Exceptional 49.1% |
| Immigrants | Pakistan | 99.7 /100 | #23 | Exceptional 49.1% |
| Lithuanians | 99.6 /100 | #24 | Exceptional 49.0% |
| Maltese | 99.6 /100 | #25 | Exceptional 49.0% |
| Immigrants | Korea | 99.6 /100 | #26 | Exceptional 49.0% |
Demographics Similar to Immigrants from Sierra Leone by Currently Married
In terms of currently married, the demographic groups most similar to Immigrants from Sierra Leone are Immigrants from Latin America (43.8%, a difference of 0.060%), Immigrants from Nicaragua (43.7%, a difference of 0.11%), Ute (43.9%, a difference of 0.21%), Immigrants from Africa (43.9%, a difference of 0.22%), and Bangladeshi (43.7%, a difference of 0.25%).
| Demographics | Rating | Rank | Currently Married |
| Hispanics or Latinos | 0.3 /100 | #252 | Tragic 44.1% |
| Immigrants | Central America | 0.3 /100 | #253 | Tragic 44.1% |
| Vietnamese | 0.2 /100 | #254 | Tragic 44.0% |
| Yakama | 0.2 /100 | #255 | Tragic 44.0% |
| Shoshone | 0.2 /100 | #256 | Tragic 44.0% |
| Immigrants | Africa | 0.2 /100 | #257 | Tragic 43.9% |
| Ute | 0.2 /100 | #258 | Tragic 43.9% |
| Immigrants | Sierra Leone | 0.1 /100 | #259 | Tragic 43.8% |
| Immigrants | Latin America | 0.1 /100 | #260 | Tragic 43.8% |
| Immigrants | Nicaragua | 0.1 /100 | #261 | Tragic 43.7% |
| Bangladeshis | 0.1 /100 | #262 | Tragic 43.7% |
| Immigrants | Cuba | 0.1 /100 | #263 | Tragic 43.7% |
| Sudanese | 0.1 /100 | #264 | Tragic 43.7% |
| Immigrants | Bangladesh | 0.1 /100 | #265 | Tragic 43.6% |
| Ecuadorians | 0.1 /100 | #266 | Tragic 43.6% |