Osage vs Immigrants from Grenada Currently Married
COMPARE
Osage
Immigrants from Grenada
Currently Married
Currently Married Comparison
Osage
Immigrants from Grenada
47.5%
CURRENTLY MARRIED
87.9/ 100
METRIC RATING
122nd/ 347
METRIC RANK
39.1%
CURRENTLY MARRIED
0.0/ 100
METRIC RATING
340th/ 347
METRIC RANK
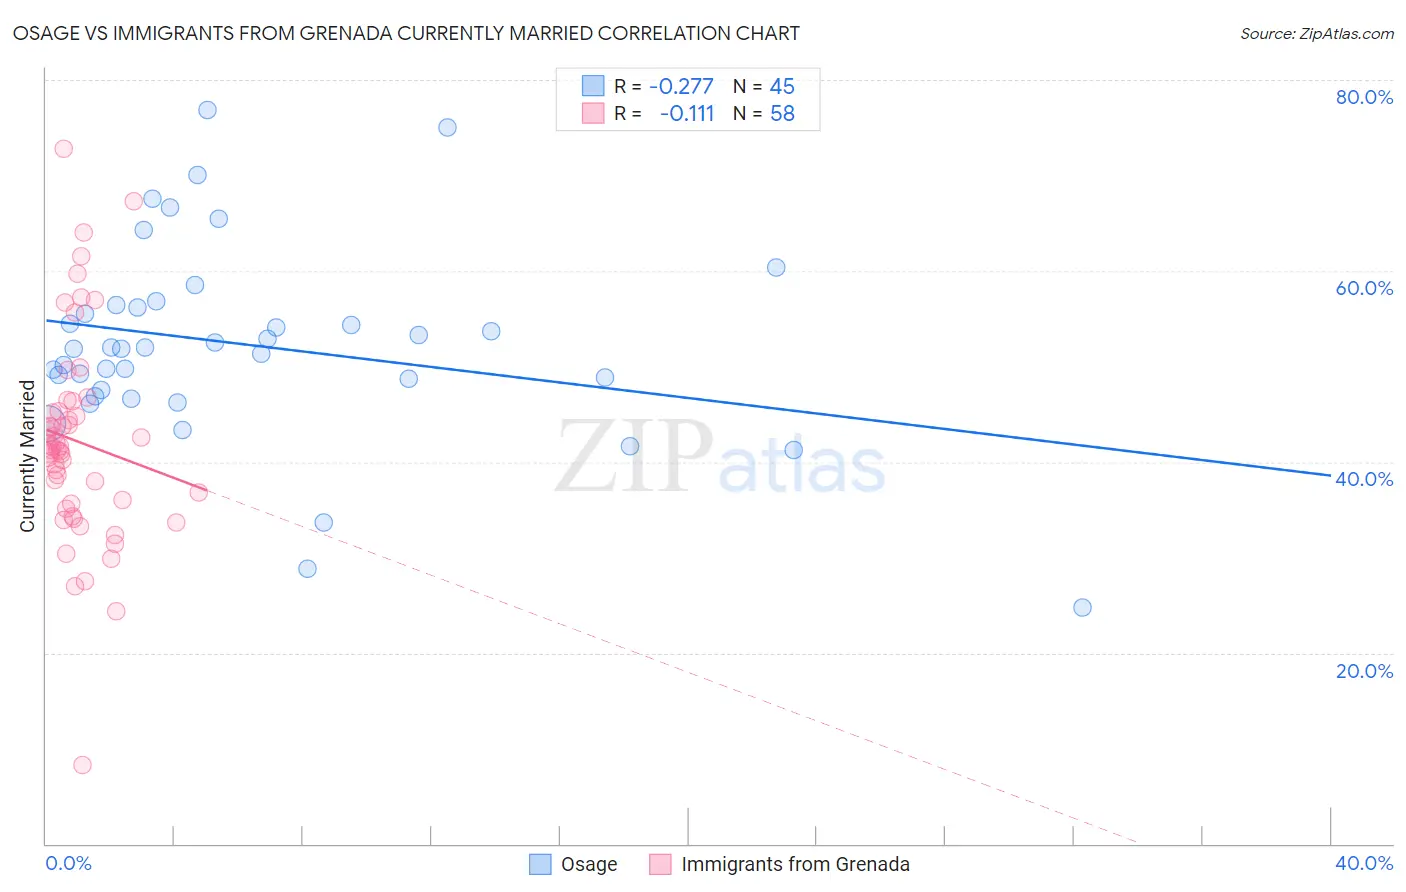
Osage vs Immigrants from Grenada Currently Married Correlation Chart
The statistical analysis conducted on geographies consisting of 91,806,752 people shows a weak negative correlation between the proportion of Osage and percentage of population currently married in the United States with a correlation coefficient (R) of -0.277 and weighted average of 47.5%. Similarly, the statistical analysis conducted on geographies consisting of 67,201,096 people shows a poor negative correlation between the proportion of Immigrants from Grenada and percentage of population currently married in the United States with a correlation coefficient (R) of -0.111 and weighted average of 39.1%, a difference of 21.3%.
Currently Married Correlation Summary
| Measurement | Osage | Immigrants from Grenada |
| Minimum | 24.7% | 8.3% |
| Maximum | 76.9% | 72.8% |
| Range | 52.2% | 64.5% |
| Mean | 52.2% | 42.2% |
| Median | 51.9% | 41.4% |
| Interquartile 25% (IQ1) | 47.2% | 35.6% |
| Interquartile 75% (IQ3) | 56.3% | 45.4% |
| Interquartile Range (IQR) | 9.1% | 9.8% |
| Standard Deviation (Sample) | 10.3% | 10.9% |
| Standard Deviation (Population) | 10.2% | 10.8% |
Similar Demographics by Currently Married
Demographics Similar to Osage by Currently Married
In terms of currently married, the demographic groups most similar to Osage are Immigrants from Croatia (47.5%, a difference of 0.060%), Immigrants from Kazakhstan (47.4%, a difference of 0.060%), Syrian (47.5%, a difference of 0.090%), Laotian (47.4%, a difference of 0.11%), and Okinawan (47.4%, a difference of 0.20%).
| Demographics | Rating | Rank | Currently Married |
| Immigrants | Indonesia | 90.5 /100 | #115 | Exceptional 47.6% |
| Palestinians | 90.4 /100 | #116 | Exceptional 47.6% |
| Puget Sound Salish | 90.3 /100 | #117 | Exceptional 47.6% |
| Immigrants | Philippines | 90.2 /100 | #118 | Exceptional 47.6% |
| Australians | 90.2 /100 | #119 | Exceptional 47.6% |
| Syrians | 88.9 /100 | #120 | Excellent 47.5% |
| Immigrants | Croatia | 88.6 /100 | #121 | Excellent 47.5% |
| Osage | 87.9 /100 | #122 | Excellent 47.5% |
| Immigrants | Kazakhstan | 87.2 /100 | #123 | Excellent 47.4% |
| Laotians | 86.6 /100 | #124 | Excellent 47.4% |
| Okinawans | 85.3 /100 | #125 | Excellent 47.4% |
| Immigrants | Jordan | 84.9 /100 | #126 | Excellent 47.4% |
| New Zealanders | 84.9 /100 | #127 | Excellent 47.4% |
| Portuguese | 84.2 /100 | #128 | Excellent 47.3% |
| Sri Lankans | 83.2 /100 | #129 | Excellent 47.3% |
Demographics Similar to Immigrants from Grenada by Currently Married
In terms of currently married, the demographic groups most similar to Immigrants from Grenada are Navajo (39.0%, a difference of 0.35%), Immigrants from Dominican Republic (38.9%, a difference of 0.52%), Dominican (39.5%, a difference of 0.96%), Cape Verdean (39.6%, a difference of 1.1%), and Black/African American (39.6%, a difference of 1.2%).
| Demographics | Rating | Rank | Currently Married |
| Yup'ik | 0.0 /100 | #333 | Tragic 39.9% |
| Puerto Ricans | 0.0 /100 | #334 | Tragic 39.9% |
| Lumbee | 0.0 /100 | #335 | Tragic 39.8% |
| British West Indians | 0.0 /100 | #336 | Tragic 39.8% |
| Blacks/African Americans | 0.0 /100 | #337 | Tragic 39.6% |
| Cape Verdeans | 0.0 /100 | #338 | Tragic 39.6% |
| Dominicans | 0.0 /100 | #339 | Tragic 39.5% |
| Immigrants | Grenada | 0.0 /100 | #340 | Tragic 39.1% |
| Navajo | 0.0 /100 | #341 | Tragic 39.0% |
| Immigrants | Dominican Republic | 0.0 /100 | #342 | Tragic 38.9% |
| Pueblo | 0.0 /100 | #343 | Tragic 38.2% |
| Immigrants | Cabo Verde | 0.0 /100 | #344 | Tragic 37.8% |
| Tohono O'odham | 0.0 /100 | #345 | Tragic 36.8% |
| Hopi | 0.0 /100 | #346 | Tragic 36.5% |
| Pima | 0.0 /100 | #347 | Tragic 35.9% |