Colville vs Immigrants from Bolivia Divorced or Separated
COMPARE
Colville
Immigrants from Bolivia
Divorced or Separated
Divorced or Separated Comparison
Colville
Immigrants from Bolivia
14.2%
DIVORCED OR SEPARATED
0.0/ 100
METRIC RATING
339th/ 347
METRIC RANK
11.3%
DIVORCED OR SEPARATED
100.0/ 100
METRIC RATING
51st/ 347
METRIC RANK
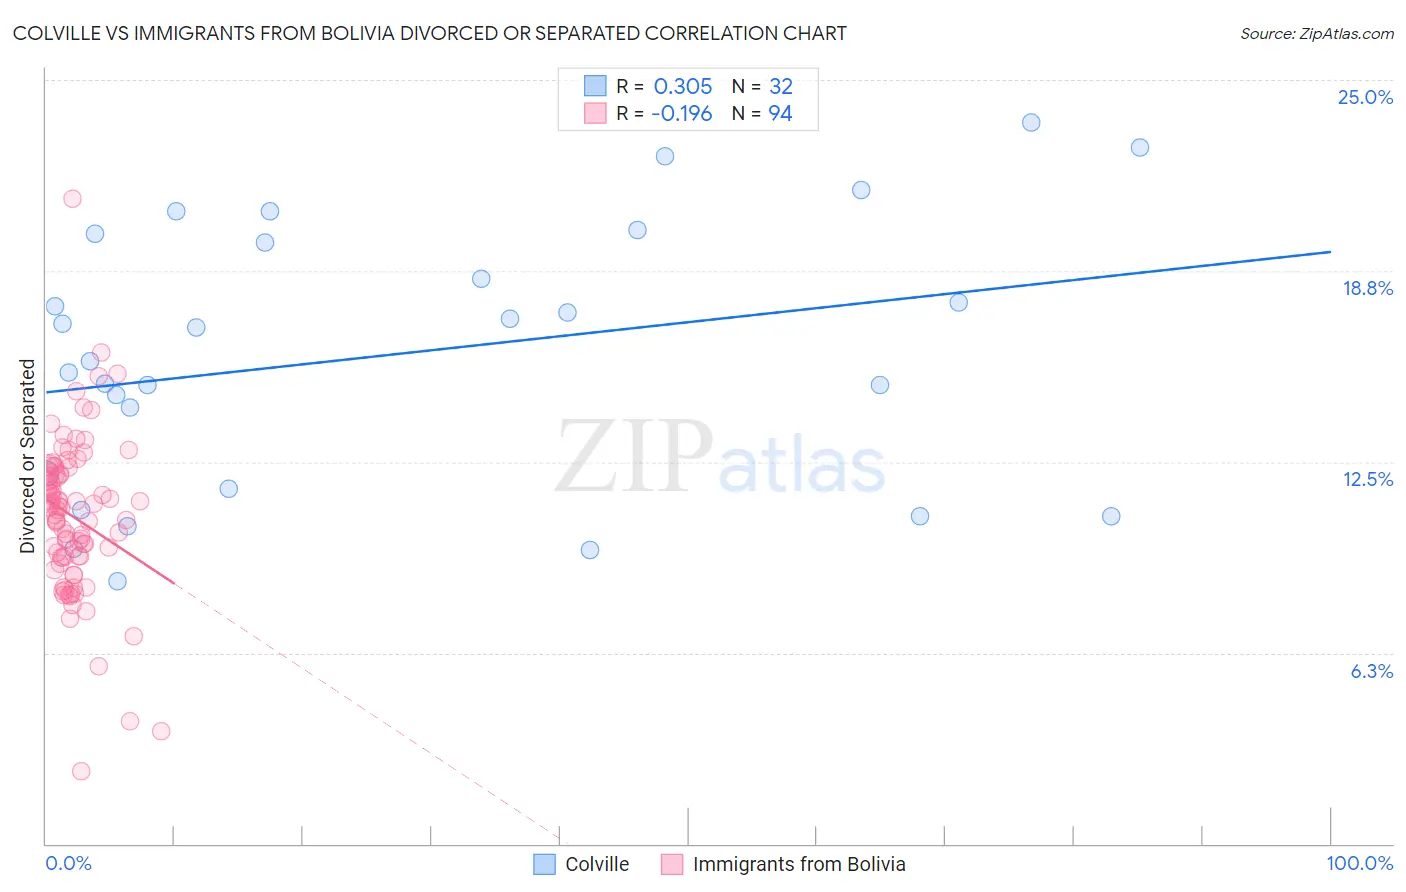
Colville vs Immigrants from Bolivia Divorced or Separated Correlation Chart
The statistical analysis conducted on geographies consisting of 34,683,925 people shows a mild positive correlation between the proportion of Colville and percentage of population currently divorced or separated in the United States with a correlation coefficient (R) of 0.305 and weighted average of 14.2%. Similarly, the statistical analysis conducted on geographies consisting of 158,719,701 people shows a poor negative correlation between the proportion of Immigrants from Bolivia and percentage of population currently divorced or separated in the United States with a correlation coefficient (R) of -0.196 and weighted average of 11.3%, a difference of 26.2%.
Divorced or Separated Correlation Summary
| Measurement | Colville | Immigrants from Bolivia |
| Minimum | 8.6% | 2.4% |
| Maximum | 23.6% | 21.1% |
| Range | 15.0% | 18.7% |
| Mean | 16.0% | 10.7% |
| Median | 16.4% | 11.0% |
| Interquartile 25% (IQ1) | 11.9% | 9.4% |
| Interquartile 75% (IQ3) | 19.8% | 12.1% |
| Interquartile Range (IQR) | 8.0% | 2.8% |
| Standard Deviation (Sample) | 4.3% | 2.6% |
| Standard Deviation (Population) | 4.2% | 2.6% |
Similar Demographics by Divorced or Separated
Demographics Similar to Colville by Divorced or Separated
In terms of divorced or separated, the demographic groups most similar to Colville are Chickasaw (14.2%, a difference of 0.040%), Bahamian (14.2%, a difference of 0.24%), Seminole (14.3%, a difference of 0.40%), Choctaw (14.1%, a difference of 0.53%), and Crow (14.1%, a difference of 0.84%).
| Demographics | Rating | Rank | Divorced or Separated |
| Cherokee | 0.0 /100 | #332 | Tragic 13.7% |
| Puerto Ricans | 0.0 /100 | #333 | Tragic 13.9% |
| Immigrants | Bahamas | 0.0 /100 | #334 | Tragic 13.9% |
| Dutch West Indians | 0.0 /100 | #335 | Tragic 14.0% |
| Shoshone | 0.0 /100 | #336 | Tragic 14.0% |
| Crow | 0.0 /100 | #337 | Tragic 14.1% |
| Choctaw | 0.0 /100 | #338 | Tragic 14.1% |
| Colville | 0.0 /100 | #339 | Tragic 14.2% |
| Chickasaw | 0.0 /100 | #340 | Tragic 14.2% |
| Bahamians | 0.0 /100 | #341 | Tragic 14.2% |
| Seminole | 0.0 /100 | #342 | Tragic 14.3% |
| Creek | 0.0 /100 | #343 | Tragic 14.4% |
| Cubans | 0.0 /100 | #344 | Tragic 14.5% |
| Kiowa | 0.0 /100 | #345 | Tragic 14.5% |
| Arapaho | 0.0 /100 | #346 | Tragic 14.8% |
Demographics Similar to Immigrants from Bolivia by Divorced or Separated
In terms of divorced or separated, the demographic groups most similar to Immigrants from Bolivia are Immigrants from Australia (11.3%, a difference of 0.11%), Bolivian (11.2%, a difference of 0.30%), Immigrants from Lithuania (11.3%, a difference of 0.33%), Immigrants from Saudi Arabia (11.2%, a difference of 0.36%), and Immigrants from Turkey (11.2%, a difference of 0.37%).
| Demographics | Rating | Rank | Divorced or Separated |
| Immigrants | Western Asia | 100.0 /100 | #44 | Exceptional 11.2% |
| Turks | 100.0 /100 | #45 | Exceptional 11.2% |
| Laotians | 100.0 /100 | #46 | Exceptional 11.2% |
| Immigrants | Poland | 100.0 /100 | #47 | Exceptional 11.2% |
| Immigrants | Turkey | 100.0 /100 | #48 | Exceptional 11.2% |
| Immigrants | Saudi Arabia | 100.0 /100 | #49 | Exceptional 11.2% |
| Bolivians | 100.0 /100 | #50 | Exceptional 11.2% |
| Immigrants | Bolivia | 100.0 /100 | #51 | Exceptional 11.3% |
| Immigrants | Australia | 99.9 /100 | #52 | Exceptional 11.3% |
| Immigrants | Lithuania | 99.9 /100 | #53 | Exceptional 11.3% |
| Eastern Europeans | 99.9 /100 | #54 | Exceptional 11.3% |
| Immigrants | Yemen | 99.9 /100 | #55 | Exceptional 11.3% |
| Immigrants | Philippines | 99.9 /100 | #56 | Exceptional 11.3% |
| Immigrants | Vietnam | 99.9 /100 | #57 | Exceptional 11.3% |
| Sri Lankans | 99.9 /100 | #58 | Exceptional 11.3% |