Canadian vs Immigrants from Greece Births to Unmarried Women
COMPARE
Canadian
Immigrants from Greece
Births to Unmarried Women
Births to Unmarried Women Comparison
Canadians
Immigrants from Greece
31.9%
BIRTHS TO UNMARRIED WOMEN
41.4/ 100
METRIC RATING
183rd/ 347
METRIC RANK
27.8%
BIRTHS TO UNMARRIED WOMEN
99.4/ 100
METRIC RATING
49th/ 347
METRIC RANK
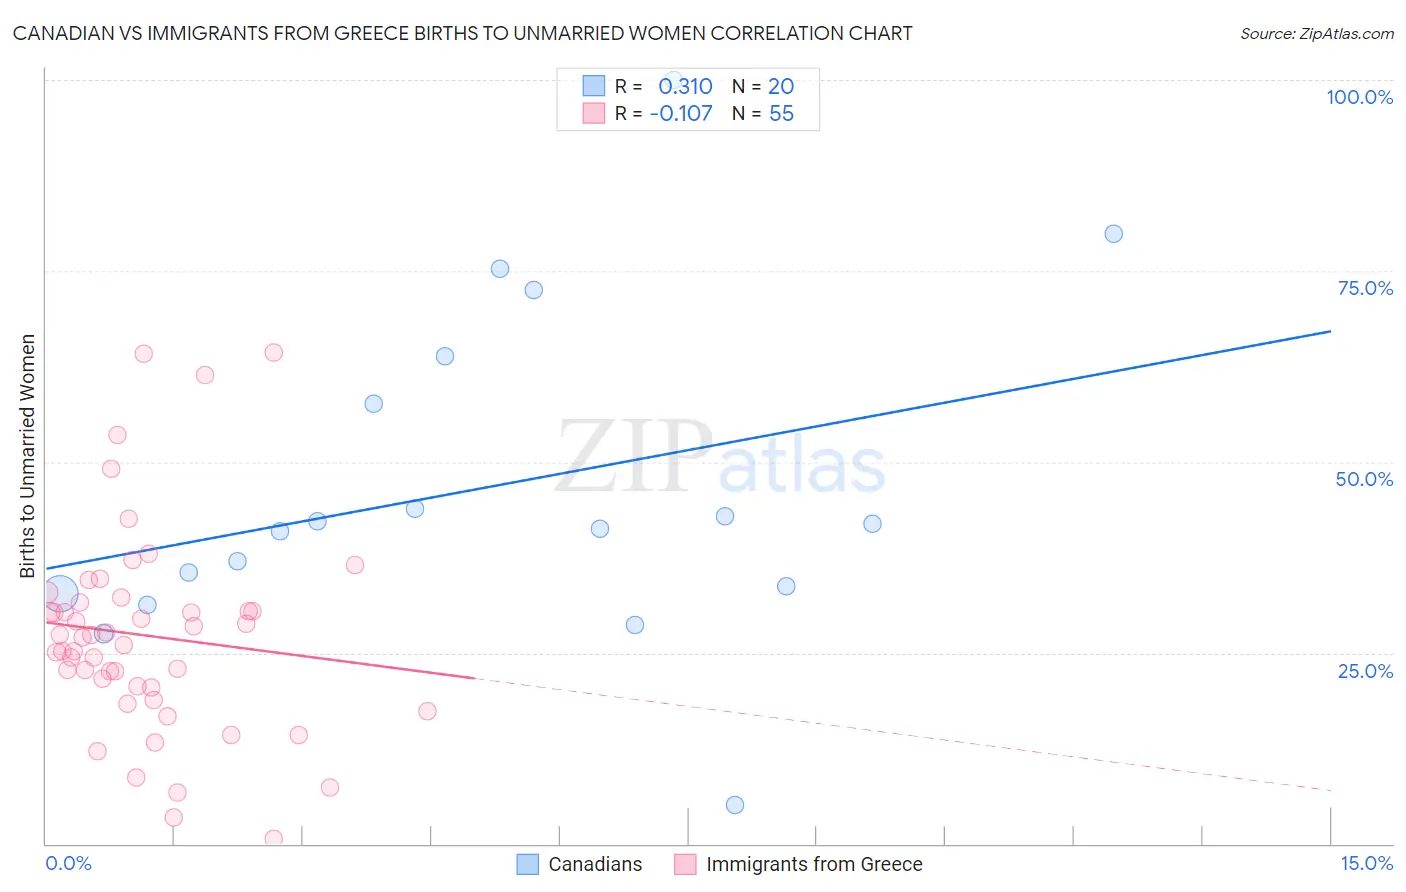
Canadian vs Immigrants from Greece Births to Unmarried Women Correlation Chart
The statistical analysis conducted on geographies consisting of 401,938,228 people shows a mild positive correlation between the proportion of Canadians and percentage of births to unmarried women in the United States with a correlation coefficient (R) of 0.310 and weighted average of 31.9%. Similarly, the statistical analysis conducted on geographies consisting of 203,732,129 people shows a poor negative correlation between the proportion of Immigrants from Greece and percentage of births to unmarried women in the United States with a correlation coefficient (R) of -0.107 and weighted average of 27.8%, a difference of 14.9%.
Births to Unmarried Women Correlation Summary
| Measurement | Canadian | Immigrants from Greece |
| Minimum | 5.0% | 0.70% |
| Maximum | 100.0% | 64.4% |
| Range | 95.0% | 63.7% |
| Mean | 46.7% | 27.2% |
| Median | 41.6% | 27.1% |
| Interquartile 25% (IQ1) | 33.2% | 20.5% |
| Interquartile 75% (IQ3) | 60.7% | 31.6% |
| Interquartile Range (IQR) | 27.6% | 11.1% |
| Standard Deviation (Sample) | 22.0% | 13.4% |
| Standard Deviation (Population) | 21.5% | 13.3% |
Similar Demographics by Births to Unmarried Women
Demographics Similar to Canadians by Births to Unmarried Women
In terms of births to unmarried women, the demographic groups most similar to Canadians are Immigrants from South America (32.0%, a difference of 0.070%), Kenyan (31.9%, a difference of 0.16%), German (32.0%, a difference of 0.18%), Welsh (32.0%, a difference of 0.31%), and Czechoslovakian (32.0%, a difference of 0.33%).
| Demographics | Rating | Rank | Births to Unmarried Women |
| Scottish | 48.1 /100 | #176 | Average 31.7% |
| South American Indians | 47.7 /100 | #177 | Average 31.7% |
| English | 47.4 /100 | #178 | Average 31.7% |
| South Americans | 46.9 /100 | #179 | Average 31.8% |
| Moroccans | 45.7 /100 | #180 | Average 31.8% |
| Immigrants | Peru | 45.1 /100 | #181 | Average 31.8% |
| Kenyans | 43.0 /100 | #182 | Average 31.9% |
| Canadians | 41.4 /100 | #183 | Average 31.9% |
| Immigrants | South America | 40.7 /100 | #184 | Average 32.0% |
| Germans | 39.5 /100 | #185 | Fair 32.0% |
| Welsh | 38.2 /100 | #186 | Fair 32.0% |
| Czechoslovakians | 38.0 /100 | #187 | Fair 32.0% |
| Osage | 37.1 /100 | #188 | Fair 32.1% |
| Immigrants | Kenya | 36.9 /100 | #189 | Fair 32.1% |
| Tlingit-Haida | 32.6 /100 | #190 | Fair 32.2% |
Demographics Similar to Immigrants from Greece by Births to Unmarried Women
In terms of births to unmarried women, the demographic groups most similar to Immigrants from Greece are Maltese (27.8%, a difference of 0.12%), Eastern European (27.7%, a difference of 0.19%), Immigrants from Lithuania (27.7%, a difference of 0.20%), Hmong (27.7%, a difference of 0.20%), and Latvian (27.7%, a difference of 0.24%).
| Demographics | Rating | Rank | Births to Unmarried Women |
| Immigrants | Eastern Europe | 99.6 /100 | #42 | Exceptional 27.6% |
| Immigrants | Bulgaria | 99.6 /100 | #43 | Exceptional 27.6% |
| Immigrants | Indonesia | 99.5 /100 | #44 | Exceptional 27.7% |
| Latvians | 99.5 /100 | #45 | Exceptional 27.7% |
| Immigrants | Lithuania | 99.5 /100 | #46 | Exceptional 27.7% |
| Hmong | 99.5 /100 | #47 | Exceptional 27.7% |
| Eastern Europeans | 99.5 /100 | #48 | Exceptional 27.7% |
| Immigrants | Greece | 99.4 /100 | #49 | Exceptional 27.8% |
| Maltese | 99.4 /100 | #50 | Exceptional 27.8% |
| Macedonians | 99.4 /100 | #51 | Exceptional 27.9% |
| Bhutanese | 99.4 /100 | #52 | Exceptional 27.9% |
| Immigrants | Romania | 99.4 /100 | #53 | Exceptional 27.9% |
| Afghans | 99.4 /100 | #54 | Exceptional 27.9% |
| Mongolians | 99.3 /100 | #55 | Exceptional 27.9% |
| Immigrants | Belgium | 99.3 /100 | #56 | Exceptional 28.0% |