Canadian vs Immigrants from France Births to Unmarried Women
COMPARE
Canadian
Immigrants from France
Births to Unmarried Women
Births to Unmarried Women Comparison
Canadians
Immigrants from France
31.9%
BIRTHS TO UNMARRIED WOMEN
41.4/ 100
METRIC RATING
183rd/ 347
METRIC RANK
29.0%
BIRTHS TO UNMARRIED WOMEN
97.3/ 100
METRIC RATING
88th/ 347
METRIC RANK
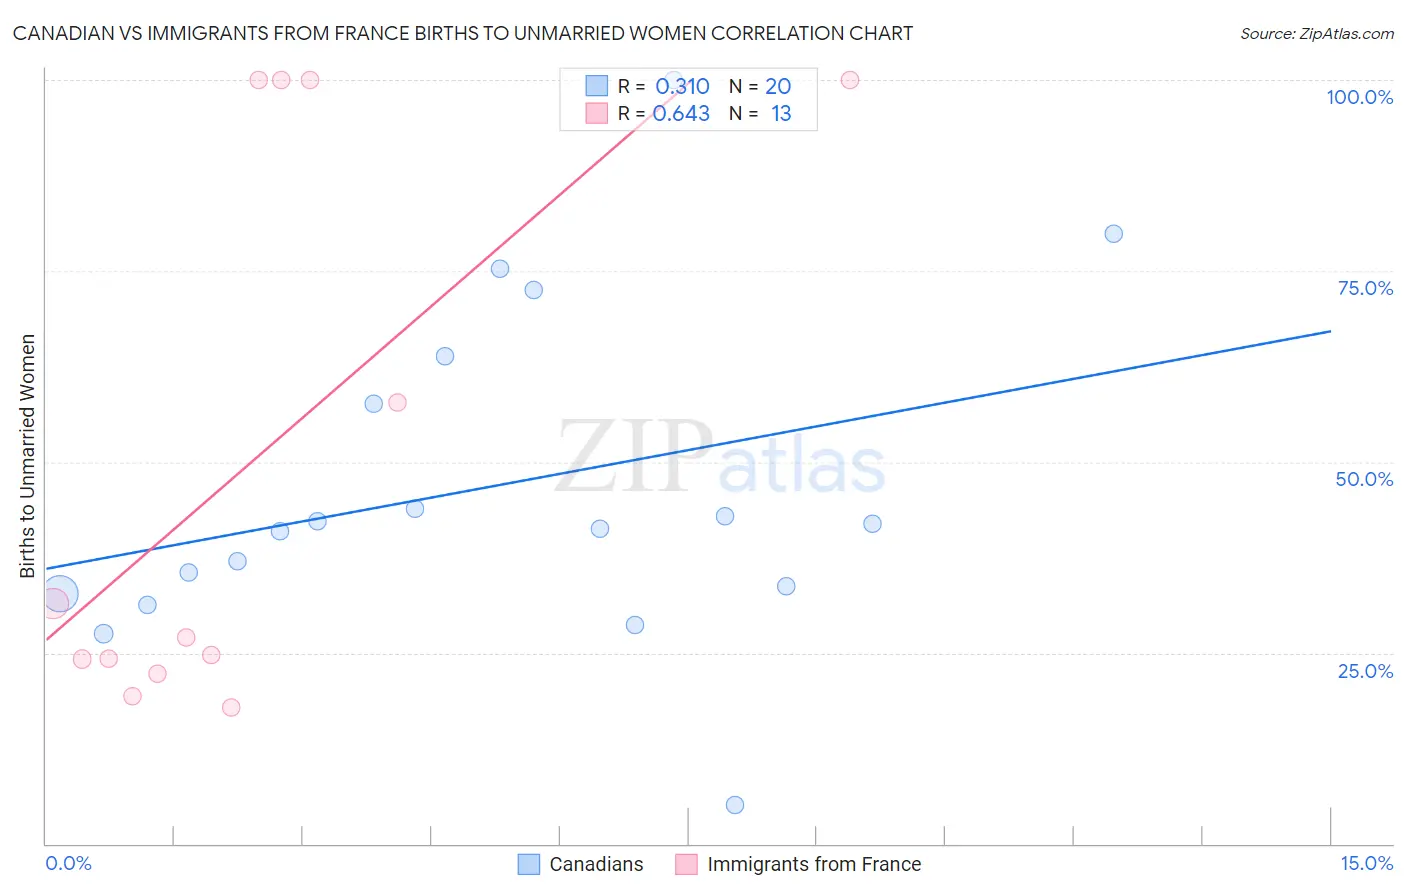
Canadian vs Immigrants from France Births to Unmarried Women Correlation Chart
The statistical analysis conducted on geographies consisting of 401,938,228 people shows a mild positive correlation between the proportion of Canadians and percentage of births to unmarried women in the United States with a correlation coefficient (R) of 0.310 and weighted average of 31.9%. Similarly, the statistical analysis conducted on geographies consisting of 270,306,848 people shows a significant positive correlation between the proportion of Immigrants from France and percentage of births to unmarried women in the United States with a correlation coefficient (R) of 0.643 and weighted average of 29.0%, a difference of 10.2%.
Births to Unmarried Women Correlation Summary
| Measurement | Canadian | Immigrants from France |
| Minimum | 5.0% | 17.9% |
| Maximum | 100.0% | 100.0% |
| Range | 95.0% | 82.1% |
| Mean | 46.7% | 49.9% |
| Median | 41.6% | 26.9% |
| Interquartile 25% (IQ1) | 33.2% | 23.2% |
| Interquartile 75% (IQ3) | 60.7% | 100.0% |
| Interquartile Range (IQR) | 27.6% | 76.8% |
| Standard Deviation (Sample) | 22.0% | 36.1% |
| Standard Deviation (Population) | 21.5% | 34.7% |
Similar Demographics by Births to Unmarried Women
Demographics Similar to Canadians by Births to Unmarried Women
In terms of births to unmarried women, the demographic groups most similar to Canadians are Immigrants from South America (32.0%, a difference of 0.070%), Kenyan (31.9%, a difference of 0.16%), German (32.0%, a difference of 0.18%), Welsh (32.0%, a difference of 0.31%), and Czechoslovakian (32.0%, a difference of 0.33%).
| Demographics | Rating | Rank | Births to Unmarried Women |
| Scottish | 48.1 /100 | #176 | Average 31.7% |
| South American Indians | 47.7 /100 | #177 | Average 31.7% |
| English | 47.4 /100 | #178 | Average 31.7% |
| South Americans | 46.9 /100 | #179 | Average 31.8% |
| Moroccans | 45.7 /100 | #180 | Average 31.8% |
| Immigrants | Peru | 45.1 /100 | #181 | Average 31.8% |
| Kenyans | 43.0 /100 | #182 | Average 31.9% |
| Canadians | 41.4 /100 | #183 | Average 31.9% |
| Immigrants | South America | 40.7 /100 | #184 | Average 32.0% |
| Germans | 39.5 /100 | #185 | Fair 32.0% |
| Welsh | 38.2 /100 | #186 | Fair 32.0% |
| Czechoslovakians | 38.0 /100 | #187 | Fair 32.0% |
| Osage | 37.1 /100 | #188 | Fair 32.1% |
| Immigrants | Kenya | 36.9 /100 | #189 | Fair 32.1% |
| Tlingit-Haida | 32.6 /100 | #190 | Fair 32.2% |
Demographics Similar to Immigrants from France by Births to Unmarried Women
In terms of births to unmarried women, the demographic groups most similar to Immigrants from France are Taiwanese (29.0%, a difference of 0.010%), Immigrants from Jordan (29.0%, a difference of 0.080%), Sri Lankan (28.9%, a difference of 0.16%), Immigrants from Saudi Arabia (29.1%, a difference of 0.28%), and Immigrants from Poland (28.9%, a difference of 0.32%).
| Demographics | Rating | Rank | Births to Unmarried Women |
| Immigrants | Austria | 98.1 /100 | #81 | Exceptional 28.7% |
| Romanians | 98.0 /100 | #82 | Exceptional 28.7% |
| Immigrants | Kuwait | 98.0 /100 | #83 | Exceptional 28.8% |
| Immigrants | Poland | 97.6 /100 | #84 | Exceptional 28.9% |
| Sri Lankans | 97.5 /100 | #85 | Exceptional 28.9% |
| Immigrants | Jordan | 97.4 /100 | #86 | Exceptional 29.0% |
| Taiwanese | 97.3 /100 | #87 | Exceptional 29.0% |
| Immigrants | France | 97.3 /100 | #88 | Exceptional 29.0% |
| Immigrants | Saudi Arabia | 97.0 /100 | #89 | Exceptional 29.1% |
| Immigrants | Latvia | 96.8 /100 | #90 | Exceptional 29.1% |
| Immigrants | Fiji | 96.6 /100 | #91 | Exceptional 29.2% |
| Arabs | 96.5 /100 | #92 | Exceptional 29.2% |
| Estonians | 96.5 /100 | #93 | Exceptional 29.2% |
| Ukrainians | 96.3 /100 | #94 | Exceptional 29.2% |
| Immigrants | Vietnam | 96.1 /100 | #95 | Exceptional 29.3% |