Cajun vs Immigrants from Lebanon Average Family Size
COMPARE
Cajun
Immigrants from Lebanon
Average Family Size
Average Family Size Comparison
Cajuns
Immigrants from Lebanon
3.17
AVERAGE FAMILY SIZE
2.4/ 100
METRIC RATING
247th/ 347
METRIC RANK
3.30
AVERAGE FAMILY SIZE
99.0/ 100
METRIC RATING
95th/ 347
METRIC RANK
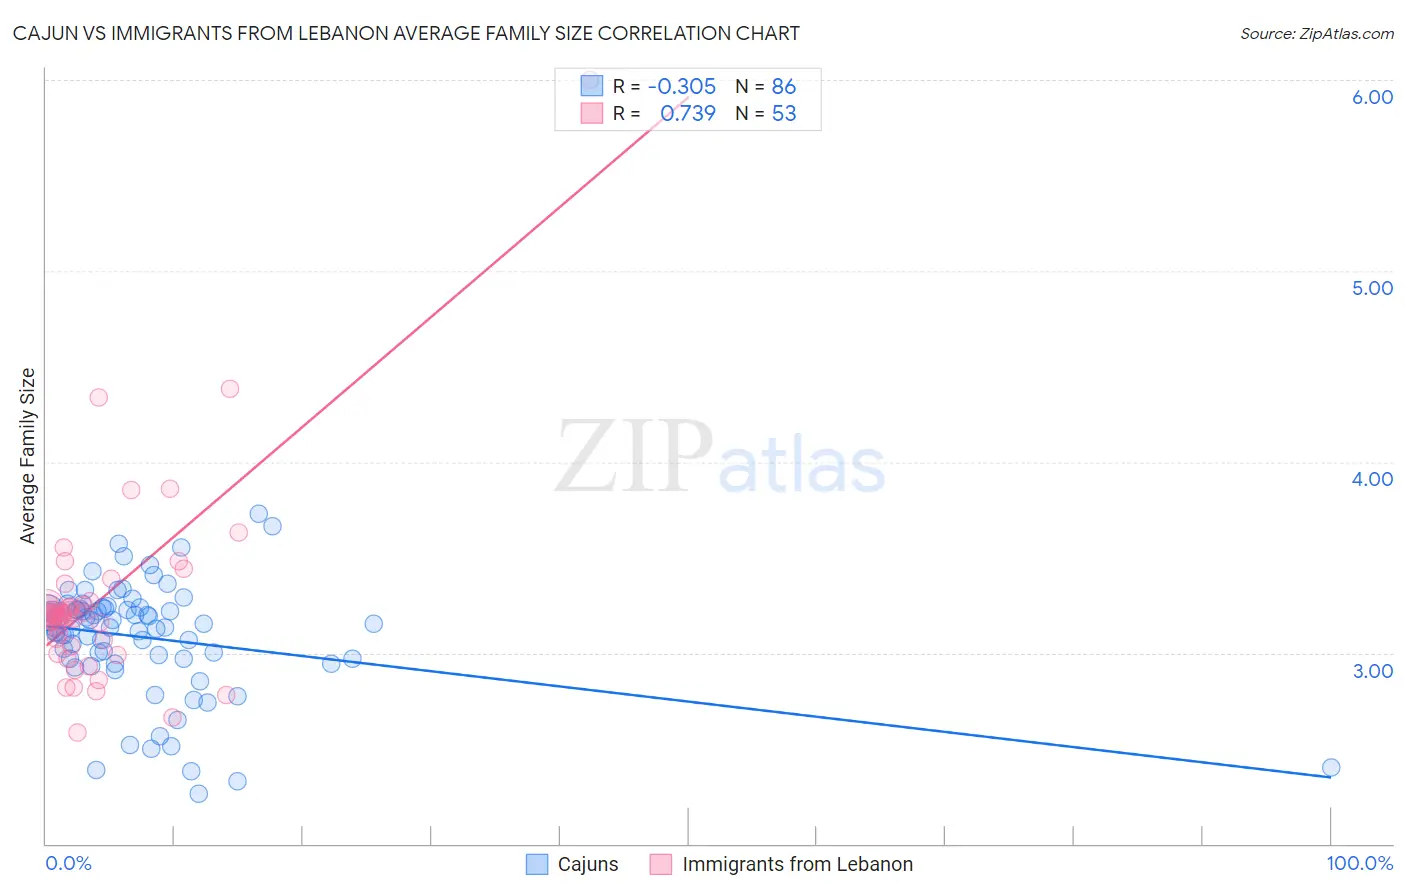
Cajun vs Immigrants from Lebanon Average Family Size Correlation Chart
The statistical analysis conducted on geographies consisting of 149,695,466 people shows a mild negative correlation between the proportion of Cajuns and average family size in the United States with a correlation coefficient (R) of -0.305 and weighted average of 3.17. Similarly, the statistical analysis conducted on geographies consisting of 217,130,535 people shows a strong positive correlation between the proportion of Immigrants from Lebanon and average family size in the United States with a correlation coefficient (R) of 0.739 and weighted average of 3.30, a difference of 3.8%.
Average Family Size Correlation Summary
| Measurement | Cajun | Immigrants from Lebanon |
| Minimum | 2.26 | 2.58 |
| Maximum | 3.73 | 6.00 |
| Range | 1.47 | 3.42 |
| Mean | 3.08 | 3.27 |
| Median | 3.14 | 3.20 |
| Interquartile 25% (IQ1) | 2.97 | 3.05 |
| Interquartile 75% (IQ3) | 3.23 | 3.26 |
| Interquartile Range (IQR) | 0.26 | 0.21 |
| Standard Deviation (Sample) | 0.30 | 0.51 |
| Standard Deviation (Population) | 0.29 | 0.51 |
Similar Demographics by Average Family Size
Demographics Similar to Cajuns by Average Family Size
In terms of average family size, the demographic groups most similar to Cajuns are Danish (3.17, a difference of 0.010%), Immigrants from Belarus (3.17, a difference of 0.030%), Immigrants from Brazil (3.18, a difference of 0.050%), Immigrants from Eastern Europe (3.17, a difference of 0.070%), and Immigrants from Southern Europe (3.18, a difference of 0.080%).
| Demographics | Rating | Rank | Average Family Size |
| Osage | 3.2 /100 | #240 | Tragic 3.18 |
| Immigrants | Japan | 3.0 /100 | #241 | Tragic 3.18 |
| Hungarians | 3.0 /100 | #242 | Tragic 3.18 |
| Immigrants | Moldova | 2.9 /100 | #243 | Tragic 3.18 |
| Immigrants | Southern Europe | 2.9 /100 | #244 | Tragic 3.18 |
| Immigrants | Brazil | 2.7 /100 | #245 | Tragic 3.18 |
| Danes | 2.5 /100 | #246 | Tragic 3.17 |
| Cajuns | 2.4 /100 | #247 | Tragic 3.17 |
| Immigrants | Belarus | 2.3 /100 | #248 | Tragic 3.17 |
| Immigrants | Eastern Europe | 2.1 /100 | #249 | Tragic 3.17 |
| Puget Sound Salish | 1.9 /100 | #250 | Tragic 3.17 |
| Immigrants | Spain | 1.8 /100 | #251 | Tragic 3.17 |
| Immigrants | Saudi Arabia | 1.7 /100 | #252 | Tragic 3.17 |
| South Africans | 1.7 /100 | #253 | Tragic 3.17 |
| Immigrants | Hungary | 1.7 /100 | #254 | Tragic 3.17 |
Demographics Similar to Immigrants from Lebanon by Average Family Size
In terms of average family size, the demographic groups most similar to Immigrants from Lebanon are Sierra Leonean (3.30, a difference of 0.010%), U.S. Virgin Islander (3.29, a difference of 0.080%), Peruvian (3.30, a difference of 0.11%), Immigrants from Cameroon (3.30, a difference of 0.12%), and Immigrants from Oceania (3.29, a difference of 0.12%).
| Demographics | Rating | Rank | Average Family Size |
| Immigrants | Bolivia | 99.6 /100 | #88 | Exceptional 3.31 |
| Malaysians | 99.6 /100 | #89 | Exceptional 3.31 |
| Menominee | 99.4 /100 | #90 | Exceptional 3.30 |
| Immigrants | Pakistan | 99.2 /100 | #91 | Exceptional 3.30 |
| Immigrants | Cameroon | 99.2 /100 | #92 | Exceptional 3.30 |
| Peruvians | 99.2 /100 | #93 | Exceptional 3.30 |
| Sierra Leoneans | 99.0 /100 | #94 | Exceptional 3.30 |
| Immigrants | Lebanon | 99.0 /100 | #95 | Exceptional 3.30 |
| U.S. Virgin Islanders | 98.8 /100 | #96 | Exceptional 3.29 |
| Immigrants | Oceania | 98.7 /100 | #97 | Exceptional 3.29 |
| Barbadians | 98.6 /100 | #98 | Exceptional 3.29 |
| Nigerians | 98.6 /100 | #99 | Exceptional 3.29 |
| Guamanians/Chamorros | 98.6 /100 | #100 | Exceptional 3.29 |
| Immigrants | Burma/Myanmar | 98.6 /100 | #101 | Exceptional 3.29 |
| West Indians | 98.5 /100 | #102 | Exceptional 3.29 |