Cajun vs Bahamian Average Family Size
COMPARE
Cajun
Bahamian
Average Family Size
Average Family Size Comparison
Cajuns
Bahamians
3.17
AVERAGE FAMILY SIZE
2.4/ 100
METRIC RATING
247th/ 347
METRIC RANK
3.28
AVERAGE FAMILY SIZE
96.6/ 100
METRIC RATING
110th/ 347
METRIC RANK
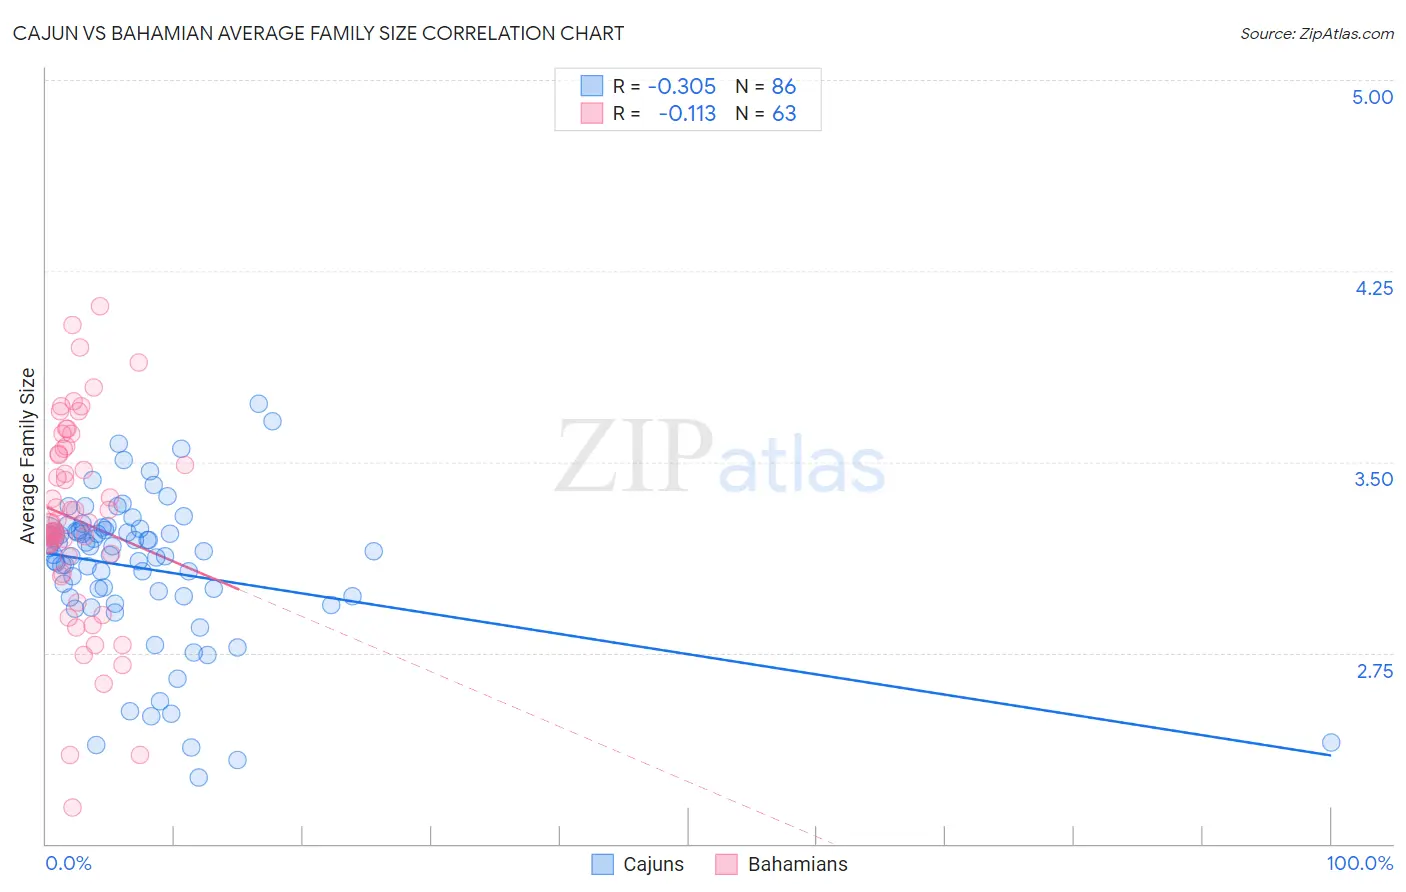
Cajun vs Bahamian Average Family Size Correlation Chart
The statistical analysis conducted on geographies consisting of 149,695,466 people shows a mild negative correlation between the proportion of Cajuns and average family size in the United States with a correlation coefficient (R) of -0.305 and weighted average of 3.17. Similarly, the statistical analysis conducted on geographies consisting of 112,635,727 people shows a poor negative correlation between the proportion of Bahamians and average family size in the United States with a correlation coefficient (R) of -0.113 and weighted average of 3.28, a difference of 3.3%.
Average Family Size Correlation Summary
| Measurement | Cajun | Bahamian |
| Minimum | 2.26 | 2.14 |
| Maximum | 3.73 | 4.11 |
| Range | 1.47 | 1.97 |
| Mean | 3.08 | 3.27 |
| Median | 3.14 | 3.26 |
| Interquartile 25% (IQ1) | 2.97 | 3.13 |
| Interquartile 75% (IQ3) | 3.23 | 3.55 |
| Interquartile Range (IQR) | 0.26 | 0.42 |
| Standard Deviation (Sample) | 0.30 | 0.40 |
| Standard Deviation (Population) | 0.29 | 0.39 |
Similar Demographics by Average Family Size
Demographics Similar to Cajuns by Average Family Size
In terms of average family size, the demographic groups most similar to Cajuns are Danish (3.17, a difference of 0.010%), Immigrants from Belarus (3.17, a difference of 0.030%), Immigrants from Brazil (3.18, a difference of 0.050%), Immigrants from Eastern Europe (3.17, a difference of 0.070%), and Immigrants from Southern Europe (3.18, a difference of 0.080%).
| Demographics | Rating | Rank | Average Family Size |
| Osage | 3.2 /100 | #240 | Tragic 3.18 |
| Immigrants | Japan | 3.0 /100 | #241 | Tragic 3.18 |
| Hungarians | 3.0 /100 | #242 | Tragic 3.18 |
| Immigrants | Moldova | 2.9 /100 | #243 | Tragic 3.18 |
| Immigrants | Southern Europe | 2.9 /100 | #244 | Tragic 3.18 |
| Immigrants | Brazil | 2.7 /100 | #245 | Tragic 3.18 |
| Danes | 2.5 /100 | #246 | Tragic 3.17 |
| Cajuns | 2.4 /100 | #247 | Tragic 3.17 |
| Immigrants | Belarus | 2.3 /100 | #248 | Tragic 3.17 |
| Immigrants | Eastern Europe | 2.1 /100 | #249 | Tragic 3.17 |
| Puget Sound Salish | 1.9 /100 | #250 | Tragic 3.17 |
| Immigrants | Spain | 1.8 /100 | #251 | Tragic 3.17 |
| Immigrants | Saudi Arabia | 1.7 /100 | #252 | Tragic 3.17 |
| South Africans | 1.7 /100 | #253 | Tragic 3.17 |
| Immigrants | Hungary | 1.7 /100 | #254 | Tragic 3.17 |
Demographics Similar to Bahamians by Average Family Size
In terms of average family size, the demographic groups most similar to Bahamians are Puerto Rican (3.28, a difference of 0.020%), Indonesian (3.28, a difference of 0.050%), Asian (3.28, a difference of 0.060%), Black/African American (3.27, a difference of 0.11%), and Immigrants from Panama (3.27, a difference of 0.12%).
| Demographics | Rating | Rank | Average Family Size |
| Immigrants | Western Africa | 98.4 /100 | #103 | Exceptional 3.29 |
| Bolivians | 98.3 /100 | #104 | Exceptional 3.29 |
| Immigrants | Ghana | 98.1 /100 | #105 | Exceptional 3.29 |
| Paiute | 98.0 /100 | #106 | Exceptional 3.29 |
| Ghanaians | 98.0 /100 | #107 | Exceptional 3.29 |
| Asians | 97.0 /100 | #108 | Exceptional 3.28 |
| Puerto Ricans | 96.7 /100 | #109 | Exceptional 3.28 |
| Bahamians | 96.6 /100 | #110 | Exceptional 3.28 |
| Indonesians | 96.2 /100 | #111 | Exceptional 3.28 |
| Blacks/African Americans | 95.7 /100 | #112 | Exceptional 3.27 |
| Immigrants | Panama | 95.6 /100 | #113 | Exceptional 3.27 |
| South Americans | 95.1 /100 | #114 | Exceptional 3.27 |
| Immigrants | Liberia | 95.0 /100 | #115 | Exceptional 3.27 |
| Immigrants | South America | 95.0 /100 | #116 | Exceptional 3.27 |
| Kiowa | 94.8 /100 | #117 | Exceptional 3.27 |