Burmese vs Jamaican Unemployment Among Youth under 25 years
COMPARE
Burmese
Jamaican
Unemployment Among Youth under 25 years
Unemployment Among Youth under 25 years Comparison
Burmese
Jamaicans
11.3%
UNEMPLOYMENT AMONG YOUTH UNDER 25 YEARS
89.8/ 100
METRIC RATING
116th/ 347
METRIC RANK
14.4%
UNEMPLOYMENT AMONG YOUTH UNDER 25 YEARS
0.0/ 100
METRIC RATING
314th/ 347
METRIC RANK
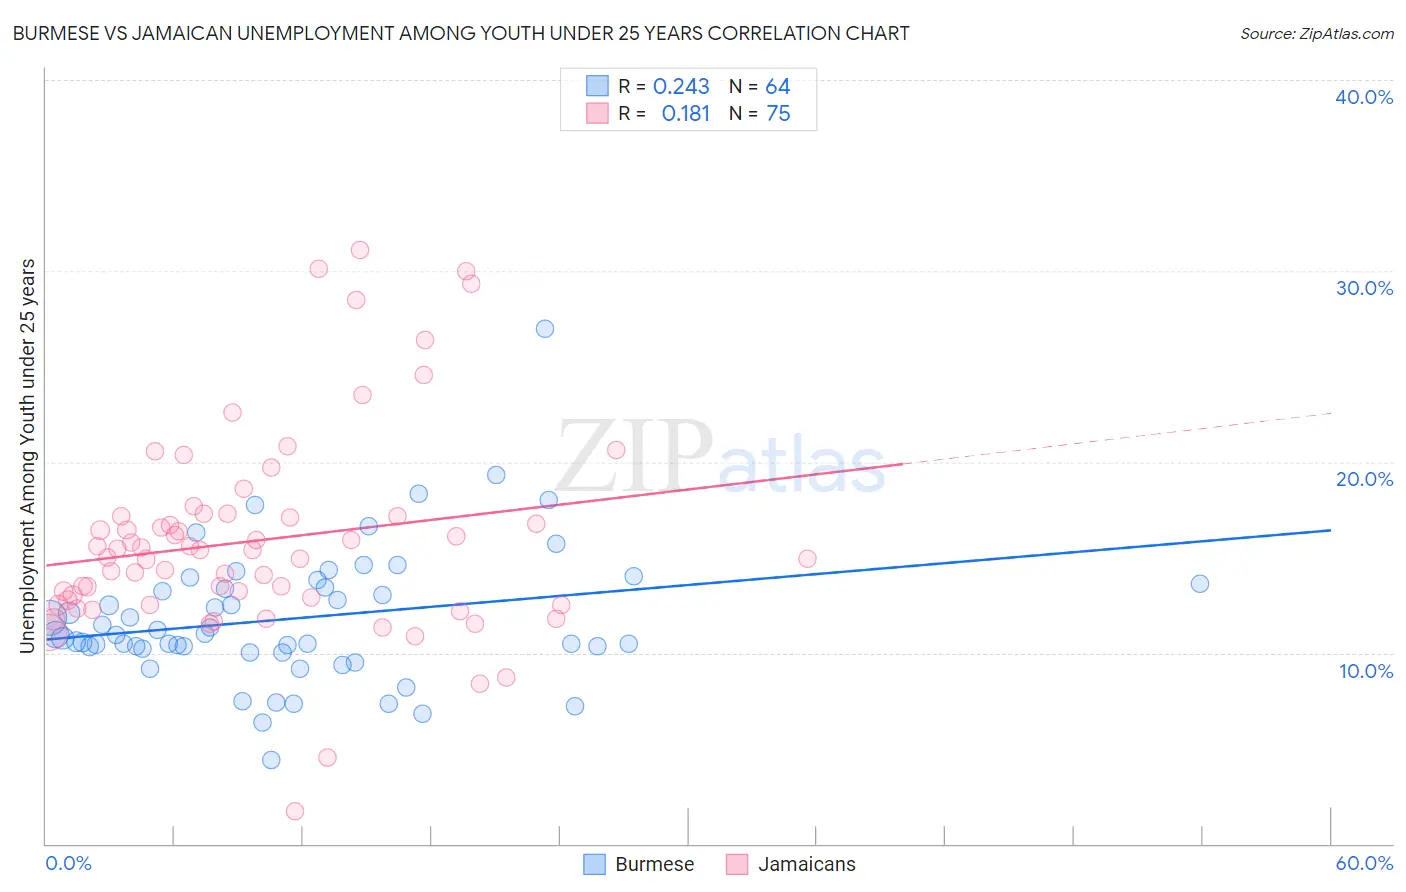
Burmese vs Jamaican Unemployment Among Youth under 25 years Correlation Chart
The statistical analysis conducted on geographies consisting of 457,894,407 people shows a weak positive correlation between the proportion of Burmese and unemployment rate among youth under the age of 25 in the United States with a correlation coefficient (R) of 0.243 and weighted average of 11.3%. Similarly, the statistical analysis conducted on geographies consisting of 364,456,442 people shows a poor positive correlation between the proportion of Jamaicans and unemployment rate among youth under the age of 25 in the United States with a correlation coefficient (R) of 0.181 and weighted average of 14.4%, a difference of 26.8%.
Unemployment Among Youth under 25 years Correlation Summary
| Measurement | Burmese | Jamaican |
| Minimum | 4.4% | 1.7% |
| Maximum | 27.0% | 31.1% |
| Range | 22.6% | 29.4% |
| Mean | 11.8% | 15.9% |
| Median | 11.0% | 15.4% |
| Interquartile 25% (IQ1) | 10.3% | 12.5% |
| Interquartile 75% (IQ3) | 13.5% | 17.2% |
| Interquartile Range (IQR) | 3.2% | 4.6% |
| Standard Deviation (Sample) | 3.6% | 5.4% |
| Standard Deviation (Population) | 3.5% | 5.4% |
Similar Demographics by Unemployment Among Youth under 25 years
Demographics Similar to Burmese by Unemployment Among Youth under 25 years
In terms of unemployment among youth under 25 years, the demographic groups most similar to Burmese are Immigrants from Vietnam (11.3%, a difference of 0.010%), Sri Lankan (11.3%, a difference of 0.010%), Afghan (11.3%, a difference of 0.010%), Immigrants from Ethiopia (11.3%, a difference of 0.020%), and Fijian (11.3%, a difference of 0.050%).
| Demographics | Rating | Rank | Unemployment Among Youth under 25 years |
| Iranians | 92.0 /100 | #109 | Exceptional 11.3% |
| Immigrants | Norway | 91.5 /100 | #110 | Exceptional 11.3% |
| Immigrants | France | 90.3 /100 | #111 | Exceptional 11.3% |
| Immigrants | Austria | 90.3 /100 | #112 | Exceptional 11.3% |
| Fijians | 90.2 /100 | #113 | Exceptional 11.3% |
| Immigrants | Ethiopia | 89.9 /100 | #114 | Excellent 11.3% |
| Immigrants | Vietnam | 89.9 /100 | #115 | Excellent 11.3% |
| Burmese | 89.8 /100 | #116 | Excellent 11.3% |
| Sri Lankans | 89.8 /100 | #117 | Excellent 11.3% |
| Afghans | 89.7 /100 | #118 | Excellent 11.3% |
| Immigrants | Scotland | 89.2 /100 | #119 | Excellent 11.4% |
| Malaysians | 89.0 /100 | #120 | Excellent 11.4% |
| Slovaks | 88.9 /100 | #121 | Excellent 11.4% |
| Immigrants | Micronesia | 88.1 /100 | #122 | Excellent 11.4% |
| Basques | 87.8 /100 | #123 | Excellent 11.4% |
Demographics Similar to Jamaicans by Unemployment Among Youth under 25 years
In terms of unemployment among youth under 25 years, the demographic groups most similar to Jamaicans are Immigrants from Armenia (14.4%, a difference of 0.090%), Sioux (14.4%, a difference of 0.11%), Native/Alaskan (14.5%, a difference of 0.54%), Black/African American (14.5%, a difference of 0.63%), and Vietnamese (14.3%, a difference of 0.92%).
| Demographics | Rating | Rank | Unemployment Among Youth under 25 years |
| Immigrants | Haiti | 0.0 /100 | #307 | Tragic 14.0% |
| Immigrants | Belize | 0.0 /100 | #308 | Tragic 14.0% |
| Aleuts | 0.0 /100 | #309 | Tragic 14.1% |
| Immigrants | West Indies | 0.0 /100 | #310 | Tragic 14.2% |
| Immigrants | Bangladesh | 0.0 /100 | #311 | Tragic 14.2% |
| Vietnamese | 0.0 /100 | #312 | Tragic 14.3% |
| Immigrants | Armenia | 0.0 /100 | #313 | Tragic 14.4% |
| Jamaicans | 0.0 /100 | #314 | Tragic 14.4% |
| Sioux | 0.0 /100 | #315 | Tragic 14.4% |
| Natives/Alaskans | 0.0 /100 | #316 | Tragic 14.5% |
| Blacks/African Americans | 0.0 /100 | #317 | Tragic 14.5% |
| Immigrants | Dominica | 0.0 /100 | #318 | Tragic 14.6% |
| West Indians | 0.0 /100 | #319 | Tragic 14.6% |
| Barbadians | 0.0 /100 | #320 | Tragic 14.6% |
| Cheyenne | 0.0 /100 | #321 | Tragic 14.6% |