Burmese vs Immigrants from Panama Currently Married
COMPARE
Burmese
Immigrants from Panama
Currently Married
Currently Married Comparison
Burmese
Immigrants from Panama
48.9%
CURRENTLY MARRIED
99.6/ 100
METRIC RATING
27th/ 347
METRIC RANK
44.9%
CURRENTLY MARRIED
1.5/ 100
METRIC RATING
231st/ 347
METRIC RANK
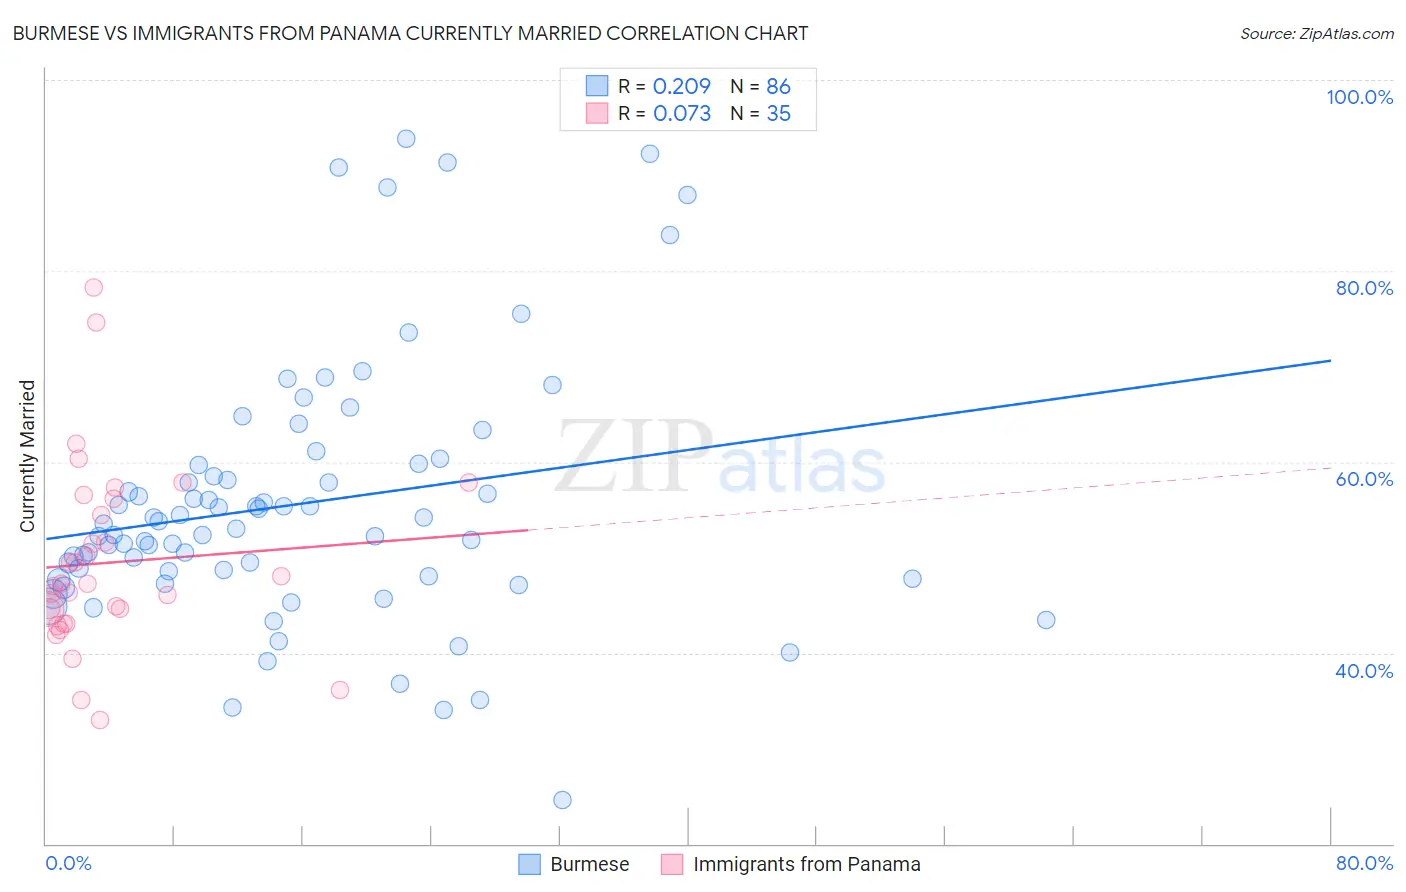
Burmese vs Immigrants from Panama Currently Married Correlation Chart
The statistical analysis conducted on geographies consisting of 465,297,934 people shows a weak positive correlation between the proportion of Burmese and percentage of population currently married in the United States with a correlation coefficient (R) of 0.209 and weighted average of 48.9%. Similarly, the statistical analysis conducted on geographies consisting of 221,180,776 people shows a slight positive correlation between the proportion of Immigrants from Panama and percentage of population currently married in the United States with a correlation coefficient (R) of 0.073 and weighted average of 44.9%, a difference of 9.1%.
Currently Married Correlation Summary
| Measurement | Burmese | Immigrants from Panama |
| Minimum | 24.6% | 32.9% |
| Maximum | 93.9% | 78.2% |
| Range | 69.3% | 45.3% |
| Mean | 55.6% | 49.5% |
| Median | 53.2% | 47.2% |
| Interquartile 25% (IQ1) | 48.0% | 43.1% |
| Interquartile 75% (IQ3) | 59.7% | 56.2% |
| Interquartile Range (IQR) | 11.7% | 13.1% |
| Standard Deviation (Sample) | 13.6% | 9.7% |
| Standard Deviation (Population) | 13.5% | 9.6% |
Similar Demographics by Currently Married
Demographics Similar to Burmese by Currently Married
In terms of currently married, the demographic groups most similar to Burmese are Welsh (48.9%, a difference of 0.040%), Immigrants from Korea (49.0%, a difference of 0.070%), Croatian (48.9%, a difference of 0.090%), Eastern European (48.9%, a difference of 0.10%), and Polish (48.9%, a difference of 0.10%).
| Demographics | Rating | Rank | Currently Married |
| Luxembourgers | 99.8 /100 | #20 | Exceptional 49.3% |
| Scottish | 99.8 /100 | #21 | Exceptional 49.2% |
| Bulgarians | 99.7 /100 | #22 | Exceptional 49.1% |
| Immigrants | Pakistan | 99.7 /100 | #23 | Exceptional 49.1% |
| Lithuanians | 99.6 /100 | #24 | Exceptional 49.0% |
| Maltese | 99.6 /100 | #25 | Exceptional 49.0% |
| Immigrants | Korea | 99.6 /100 | #26 | Exceptional 49.0% |
| Burmese | 99.6 /100 | #27 | Exceptional 48.9% |
| Welsh | 99.5 /100 | #28 | Exceptional 48.9% |
| Croatians | 99.5 /100 | #29 | Exceptional 48.9% |
| Eastern Europeans | 99.5 /100 | #30 | Exceptional 48.9% |
| Poles | 99.5 /100 | #31 | Exceptional 48.9% |
| Immigrants | Hong Kong | 99.5 /100 | #32 | Exceptional 48.9% |
| Irish | 99.5 /100 | #33 | Exceptional 48.9% |
| Immigrants | Lithuania | 99.4 /100 | #34 | Exceptional 48.8% |
Demographics Similar to Immigrants from Panama by Currently Married
In terms of currently married, the demographic groups most similar to Immigrants from Panama are Immigrants from Kenya (44.9%, a difference of 0.040%), Cree (44.9%, a difference of 0.080%), Nepalese (44.7%, a difference of 0.26%), Spanish American (45.0%, a difference of 0.27%), and Immigrants from Uruguay (45.0%, a difference of 0.27%).
| Demographics | Rating | Rank | Currently Married |
| Immigrants | Uganda | 2.2 /100 | #224 | Tragic 45.0% |
| French American Indians | 2.2 /100 | #225 | Tragic 45.0% |
| Comanche | 2.1 /100 | #226 | Tragic 45.0% |
| Spanish Americans | 2.1 /100 | #227 | Tragic 45.0% |
| Immigrants | Uruguay | 2.0 /100 | #228 | Tragic 45.0% |
| Cree | 1.7 /100 | #229 | Tragic 44.9% |
| Immigrants | Kenya | 1.6 /100 | #230 | Tragic 44.9% |
| Immigrants | Panama | 1.5 /100 | #231 | Tragic 44.9% |
| Nepalese | 1.2 /100 | #232 | Tragic 44.7% |
| Immigrants | Saudi Arabia | 1.1 /100 | #233 | Tragic 44.7% |
| Iroquois | 1.1 /100 | #234 | Tragic 44.7% |
| Alaskan Athabascans | 0.9 /100 | #235 | Tragic 44.6% |
| Cubans | 0.9 /100 | #236 | Tragic 44.6% |
| Seminole | 0.9 /100 | #237 | Tragic 44.6% |
| Moroccans | 0.9 /100 | #238 | Tragic 44.6% |