Burmese vs Immigrants from Ukraine Currently Married
COMPARE
Burmese
Immigrants from Ukraine
Currently Married
Currently Married Comparison
Burmese
Immigrants from Ukraine
48.9%
CURRENTLY MARRIED
99.6/ 100
METRIC RATING
27th/ 347
METRIC RANK
47.9%
CURRENTLY MARRIED
94.8/ 100
METRIC RATING
97th/ 347
METRIC RANK
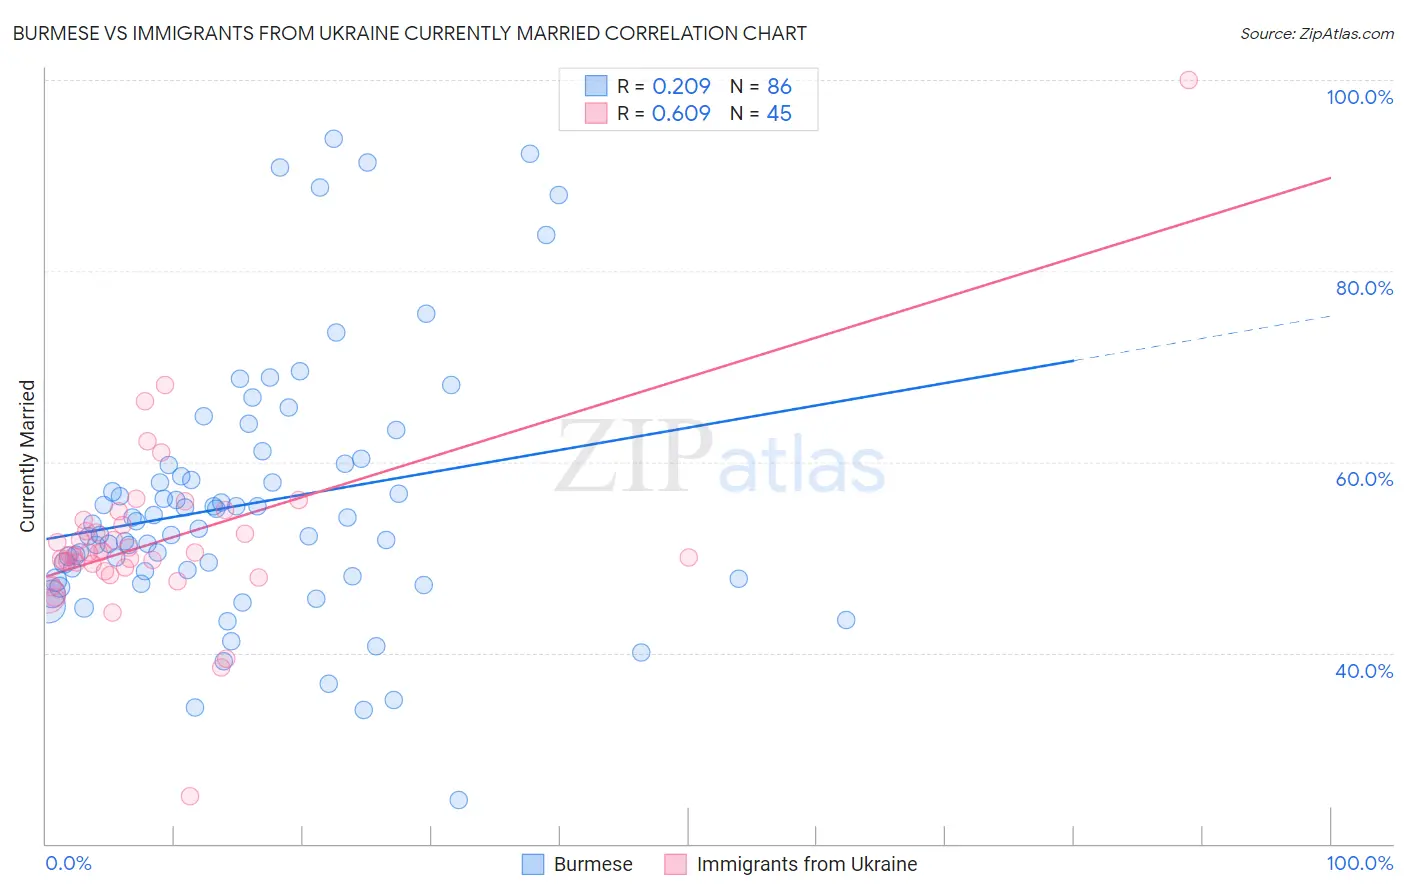
Burmese vs Immigrants from Ukraine Currently Married Correlation Chart
The statistical analysis conducted on geographies consisting of 465,297,934 people shows a weak positive correlation between the proportion of Burmese and percentage of population currently married in the United States with a correlation coefficient (R) of 0.209 and weighted average of 48.9%. Similarly, the statistical analysis conducted on geographies consisting of 289,694,818 people shows a significant positive correlation between the proportion of Immigrants from Ukraine and percentage of population currently married in the United States with a correlation coefficient (R) of 0.609 and weighted average of 47.9%, a difference of 2.2%.
Currently Married Correlation Summary
| Measurement | Burmese | Immigrants from Ukraine |
| Minimum | 24.6% | 25.0% |
| Maximum | 93.9% | 100.0% |
| Range | 69.3% | 75.0% |
| Mean | 55.6% | 51.9% |
| Median | 53.2% | 50.5% |
| Interquartile 25% (IQ1) | 48.0% | 48.7% |
| Interquartile 75% (IQ3) | 59.7% | 53.6% |
| Interquartile Range (IQR) | 11.7% | 4.9% |
| Standard Deviation (Sample) | 13.6% | 10.0% |
| Standard Deviation (Population) | 13.5% | 9.9% |
Similar Demographics by Currently Married
Demographics Similar to Burmese by Currently Married
In terms of currently married, the demographic groups most similar to Burmese are Welsh (48.9%, a difference of 0.040%), Immigrants from Korea (49.0%, a difference of 0.070%), Croatian (48.9%, a difference of 0.090%), Eastern European (48.9%, a difference of 0.10%), and Polish (48.9%, a difference of 0.10%).
| Demographics | Rating | Rank | Currently Married |
| Luxembourgers | 99.8 /100 | #20 | Exceptional 49.3% |
| Scottish | 99.8 /100 | #21 | Exceptional 49.2% |
| Bulgarians | 99.7 /100 | #22 | Exceptional 49.1% |
| Immigrants | Pakistan | 99.7 /100 | #23 | Exceptional 49.1% |
| Lithuanians | 99.6 /100 | #24 | Exceptional 49.0% |
| Maltese | 99.6 /100 | #25 | Exceptional 49.0% |
| Immigrants | Korea | 99.6 /100 | #26 | Exceptional 49.0% |
| Burmese | 99.6 /100 | #27 | Exceptional 48.9% |
| Welsh | 99.5 /100 | #28 | Exceptional 48.9% |
| Croatians | 99.5 /100 | #29 | Exceptional 48.9% |
| Eastern Europeans | 99.5 /100 | #30 | Exceptional 48.9% |
| Poles | 99.5 /100 | #31 | Exceptional 48.9% |
| Immigrants | Hong Kong | 99.5 /100 | #32 | Exceptional 48.9% |
| Irish | 99.5 /100 | #33 | Exceptional 48.9% |
| Immigrants | Lithuania | 99.4 /100 | #34 | Exceptional 48.8% |
Demographics Similar to Immigrants from Ukraine by Currently Married
In terms of currently married, the demographic groups most similar to Immigrants from Ukraine are Immigrants from Bulgaria (47.9%, a difference of 0.010%), Egyptian (47.9%, a difference of 0.010%), Immigrants from China (47.9%, a difference of 0.020%), Native Hawaiian (47.9%, a difference of 0.040%), and Lebanese (47.9%, a difference of 0.060%).
| Demographics | Rating | Rank | Currently Married |
| Americans | 95.7 /100 | #90 | Exceptional 48.0% |
| Immigrants | Bolivia | 95.6 /100 | #91 | Exceptional 47.9% |
| Koreans | 95.4 /100 | #92 | Exceptional 47.9% |
| Lebanese | 95.1 /100 | #93 | Exceptional 47.9% |
| Native Hawaiians | 95.0 /100 | #94 | Exceptional 47.9% |
| Immigrants | Bulgaria | 94.8 /100 | #95 | Exceptional 47.9% |
| Egyptians | 94.8 /100 | #96 | Exceptional 47.9% |
| Immigrants | Ukraine | 94.8 /100 | #97 | Exceptional 47.9% |
| Immigrants | China | 94.7 /100 | #98 | Exceptional 47.9% |
| Immigrants | Sweden | 94.3 /100 | #99 | Exceptional 47.8% |
| Celtics | 94.2 /100 | #100 | Exceptional 47.8% |
| Immigrants | Germany | 94.1 /100 | #101 | Exceptional 47.8% |
| Turks | 93.9 /100 | #102 | Exceptional 47.8% |
| Cypriots | 93.7 /100 | #103 | Exceptional 47.8% |
| Serbians | 93.6 /100 | #104 | Exceptional 47.8% |