Alaskan Athabascan vs Subsaharan African Single Father Households
COMPARE
Alaskan Athabascan
Subsaharan African
Single Father Households
Single Father Households Comparison
Alaskan Athabascans
Sub-Saharan Africans
3.4%
SINGLE FATHER HOUSEHOLDS
0.0/ 100
METRIC RATING
339th/ 347
METRIC RANK
2.4%
SINGLE FATHER HOUSEHOLDS
8.3/ 100
METRIC RATING
230th/ 347
METRIC RANK
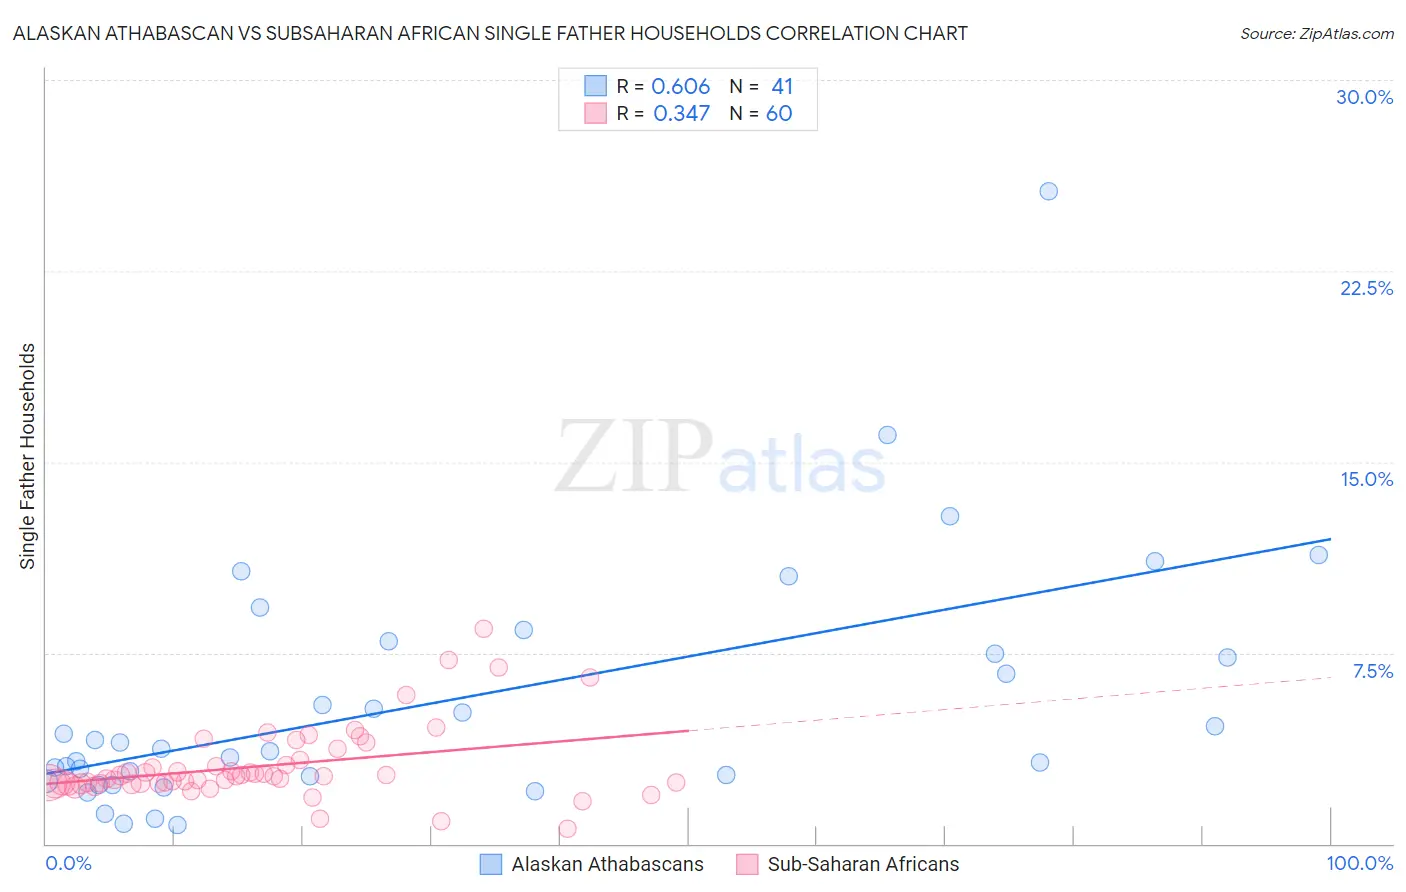
Alaskan Athabascan vs Subsaharan African Single Father Households Correlation Chart
The statistical analysis conducted on geographies consisting of 45,717,471 people shows a significant positive correlation between the proportion of Alaskan Athabascans and percentage of single father households in the United States with a correlation coefficient (R) of 0.606 and weighted average of 3.4%. Similarly, the statistical analysis conducted on geographies consisting of 500,994,896 people shows a mild positive correlation between the proportion of Sub-Saharan Africans and percentage of single father households in the United States with a correlation coefficient (R) of 0.347 and weighted average of 2.4%, a difference of 38.3%.
Single Father Households Correlation Summary
| Measurement | Alaskan Athabascan | Subsaharan African |
| Minimum | 0.71% | 0.60% |
| Maximum | 25.6% | 8.5% |
| Range | 24.9% | 7.9% |
| Mean | 5.6% | 3.1% |
| Median | 3.7% | 2.6% |
| Interquartile 25% (IQ1) | 2.6% | 2.4% |
| Interquartile 75% (IQ3) | 7.7% | 3.2% |
| Interquartile Range (IQR) | 5.2% | 0.83% |
| Standard Deviation (Sample) | 4.9% | 1.5% |
| Standard Deviation (Population) | 4.8% | 1.4% |
Similar Demographics by Single Father Households
Demographics Similar to Alaskan Athabascans by Single Father Households
In terms of single father households, the demographic groups most similar to Alaskan Athabascans are Sioux (3.3%, a difference of 1.5%), Pueblo (3.3%, a difference of 2.1%), Paiute (3.3%, a difference of 2.4%), Colville (3.3%, a difference of 2.4%), and Yuman (3.3%, a difference of 2.5%).
| Demographics | Rating | Rank | Single Father Households |
| Yaqui | 0.0 /100 | #332 | Tragic 3.2% |
| Natives/Alaskans | 0.0 /100 | #333 | Tragic 3.2% |
| Yuman | 0.0 /100 | #334 | Tragic 3.3% |
| Colville | 0.0 /100 | #335 | Tragic 3.3% |
| Paiute | 0.0 /100 | #336 | Tragic 3.3% |
| Pueblo | 0.0 /100 | #337 | Tragic 3.3% |
| Sioux | 0.0 /100 | #338 | Tragic 3.3% |
| Alaskan Athabascans | 0.0 /100 | #339 | Tragic 3.4% |
| Alaska Natives | 0.0 /100 | #340 | Tragic 3.5% |
| Crow | 0.0 /100 | #341 | Tragic 3.5% |
| Tohono O'odham | 0.0 /100 | #342 | Tragic 3.8% |
| Pima | 0.0 /100 | #343 | Tragic 4.2% |
| Yakama | 0.0 /100 | #344 | Tragic 4.2% |
| Menominee | 0.0 /100 | #345 | Tragic 4.2% |
| Inupiat | 0.0 /100 | #346 | Tragic 4.9% |
Demographics Similar to Sub-Saharan Africans by Single Father Households
In terms of single father households, the demographic groups most similar to Sub-Saharan Africans are Immigrants from Zaire (2.4%, a difference of 0.090%), Nonimmigrants (2.4%, a difference of 0.16%), Immigrants from Ghana (2.4%, a difference of 0.20%), American (2.4%, a difference of 0.24%), and Pennsylvania German (2.4%, a difference of 0.25%).
| Demographics | Rating | Rank | Single Father Households |
| Immigrants | Uruguay | 11.0 /100 | #223 | Poor 2.4% |
| Immigrants | Bahamas | 10.6 /100 | #224 | Poor 2.4% |
| Marshallese | 9.7 /100 | #225 | Tragic 2.4% |
| Blacks/African Americans | 9.7 /100 | #226 | Tragic 2.4% |
| Americans | 9.3 /100 | #227 | Tragic 2.4% |
| Immigrants | Ghana | 9.1 /100 | #228 | Tragic 2.4% |
| Immigrants | Zaire | 8.6 /100 | #229 | Tragic 2.4% |
| Sub-Saharan Africans | 8.3 /100 | #230 | Tragic 2.4% |
| Immigrants | Nonimmigrants | 7.6 /100 | #231 | Tragic 2.4% |
| Pennsylvania Germans | 7.3 /100 | #232 | Tragic 2.4% |
| Immigrants | Western Africa | 7.0 /100 | #233 | Tragic 2.4% |
| Africans | 6.3 /100 | #234 | Tragic 2.5% |
| Immigrants | Immigrants | 6.3 /100 | #235 | Tragic 2.5% |
| Cajuns | 6.1 /100 | #236 | Tragic 2.5% |
| Sierra Leoneans | 5.9 /100 | #237 | Tragic 2.5% |