Immigrants from Central America vs Subsaharan African Single Father Households
COMPARE
Immigrants from Central America
Subsaharan African
Single Father Households
Single Father Households Comparison
Immigrants from Central America
Sub-Saharan Africans
3.0%
SINGLE FATHER HOUSEHOLDS
0.0/ 100
METRIC RATING
323rd/ 347
METRIC RANK
2.4%
SINGLE FATHER HOUSEHOLDS
8.3/ 100
METRIC RATING
230th/ 347
METRIC RANK
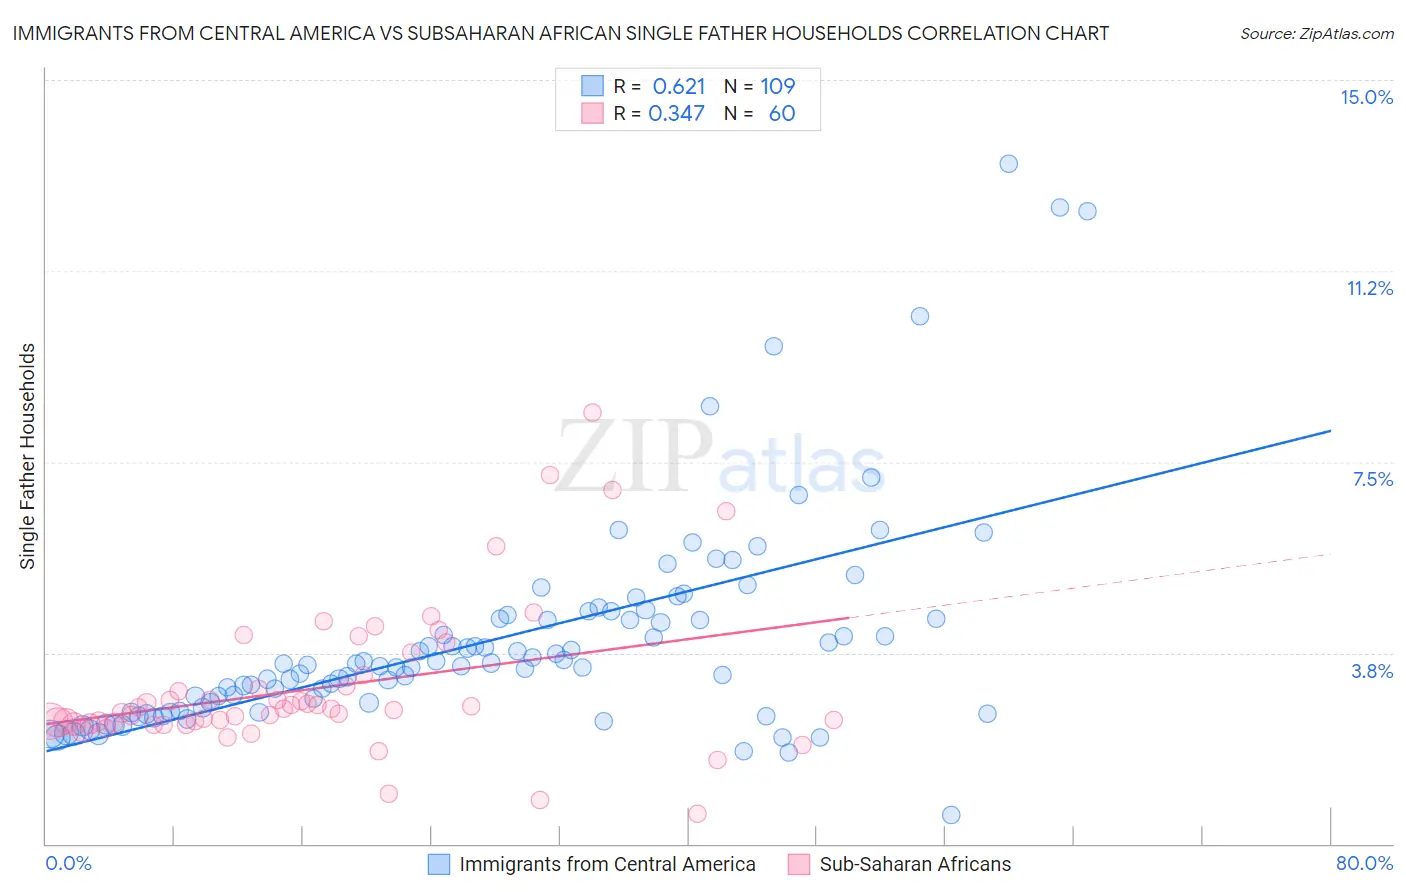
Immigrants from Central America vs Subsaharan African Single Father Households Correlation Chart
The statistical analysis conducted on geographies consisting of 526,445,722 people shows a significant positive correlation between the proportion of Immigrants from Central America and percentage of single father households in the United States with a correlation coefficient (R) of 0.621 and weighted average of 3.0%. Similarly, the statistical analysis conducted on geographies consisting of 500,994,896 people shows a mild positive correlation between the proportion of Sub-Saharan Africans and percentage of single father households in the United States with a correlation coefficient (R) of 0.347 and weighted average of 2.4%, a difference of 22.9%.
Single Father Households Correlation Summary
| Measurement | Immigrants from Central America | Subsaharan African |
| Minimum | 0.56% | 0.60% |
| Maximum | 13.4% | 8.5% |
| Range | 12.8% | 7.9% |
| Mean | 4.0% | 3.1% |
| Median | 3.5% | 2.6% |
| Interquartile 25% (IQ1) | 2.6% | 2.4% |
| Interquartile 75% (IQ3) | 4.5% | 3.2% |
| Interquartile Range (IQR) | 1.8% | 0.83% |
| Standard Deviation (Sample) | 2.1% | 1.5% |
| Standard Deviation (Population) | 2.1% | 1.4% |
Similar Demographics by Single Father Households
Demographics Similar to Immigrants from Central America by Single Father Households
In terms of single father households, the demographic groups most similar to Immigrants from Central America are Fijian (3.0%, a difference of 0.080%), Immigrants from Guatemala (3.0%, a difference of 0.31%), Mexican (3.0%, a difference of 0.84%), Guatemalan (3.0%, a difference of 1.2%), and Immigrants from Mexico (3.0%, a difference of 1.3%).
| Demographics | Rating | Rank | Single Father Households |
| Houma | 0.0 /100 | #316 | Tragic 2.9% |
| Immigrants | El Salvador | 0.0 /100 | #317 | Tragic 2.9% |
| Cape Verdeans | 0.0 /100 | #318 | Tragic 2.9% |
| Ute | 0.0 /100 | #319 | Tragic 3.0% |
| Guatemalans | 0.0 /100 | #320 | Tragic 3.0% |
| Mexicans | 0.0 /100 | #321 | Tragic 3.0% |
| Immigrants | Guatemala | 0.0 /100 | #322 | Tragic 3.0% |
| Immigrants | Central America | 0.0 /100 | #323 | Tragic 3.0% |
| Fijians | 0.0 /100 | #324 | Tragic 3.0% |
| Immigrants | Mexico | 0.0 /100 | #325 | Tragic 3.0% |
| Aleuts | 0.0 /100 | #326 | Tragic 3.0% |
| Bangladeshis | 0.0 /100 | #327 | Tragic 3.1% |
| Immigrants | Cabo Verde | 0.0 /100 | #328 | Tragic 3.1% |
| Chippewa | 0.0 /100 | #329 | Tragic 3.1% |
| Nepalese | 0.0 /100 | #330 | Tragic 3.1% |
Demographics Similar to Sub-Saharan Africans by Single Father Households
In terms of single father households, the demographic groups most similar to Sub-Saharan Africans are Immigrants from Zaire (2.4%, a difference of 0.090%), Nonimmigrants (2.4%, a difference of 0.16%), Immigrants from Ghana (2.4%, a difference of 0.20%), American (2.4%, a difference of 0.24%), and Pennsylvania German (2.4%, a difference of 0.25%).
| Demographics | Rating | Rank | Single Father Households |
| Immigrants | Uruguay | 11.0 /100 | #223 | Poor 2.4% |
| Immigrants | Bahamas | 10.6 /100 | #224 | Poor 2.4% |
| Marshallese | 9.7 /100 | #225 | Tragic 2.4% |
| Blacks/African Americans | 9.7 /100 | #226 | Tragic 2.4% |
| Americans | 9.3 /100 | #227 | Tragic 2.4% |
| Immigrants | Ghana | 9.1 /100 | #228 | Tragic 2.4% |
| Immigrants | Zaire | 8.6 /100 | #229 | Tragic 2.4% |
| Sub-Saharan Africans | 8.3 /100 | #230 | Tragic 2.4% |
| Immigrants | Nonimmigrants | 7.6 /100 | #231 | Tragic 2.4% |
| Pennsylvania Germans | 7.3 /100 | #232 | Tragic 2.4% |
| Immigrants | Western Africa | 7.0 /100 | #233 | Tragic 2.4% |
| Africans | 6.3 /100 | #234 | Tragic 2.5% |
| Immigrants | Immigrants | 6.3 /100 | #235 | Tragic 2.5% |
| Cajuns | 6.1 /100 | #236 | Tragic 2.5% |
| Sierra Leoneans | 5.9 /100 | #237 | Tragic 2.5% |