Native Hawaiian vs Subsaharan African Single Father Households
COMPARE
Native Hawaiian
Subsaharan African
Single Father Households
Single Father Households Comparison
Native Hawaiians
Sub-Saharan Africans
2.5%
SINGLE FATHER HOUSEHOLDS
2.5/ 100
METRIC RATING
246th/ 347
METRIC RANK
2.4%
SINGLE FATHER HOUSEHOLDS
8.3/ 100
METRIC RATING
230th/ 347
METRIC RANK
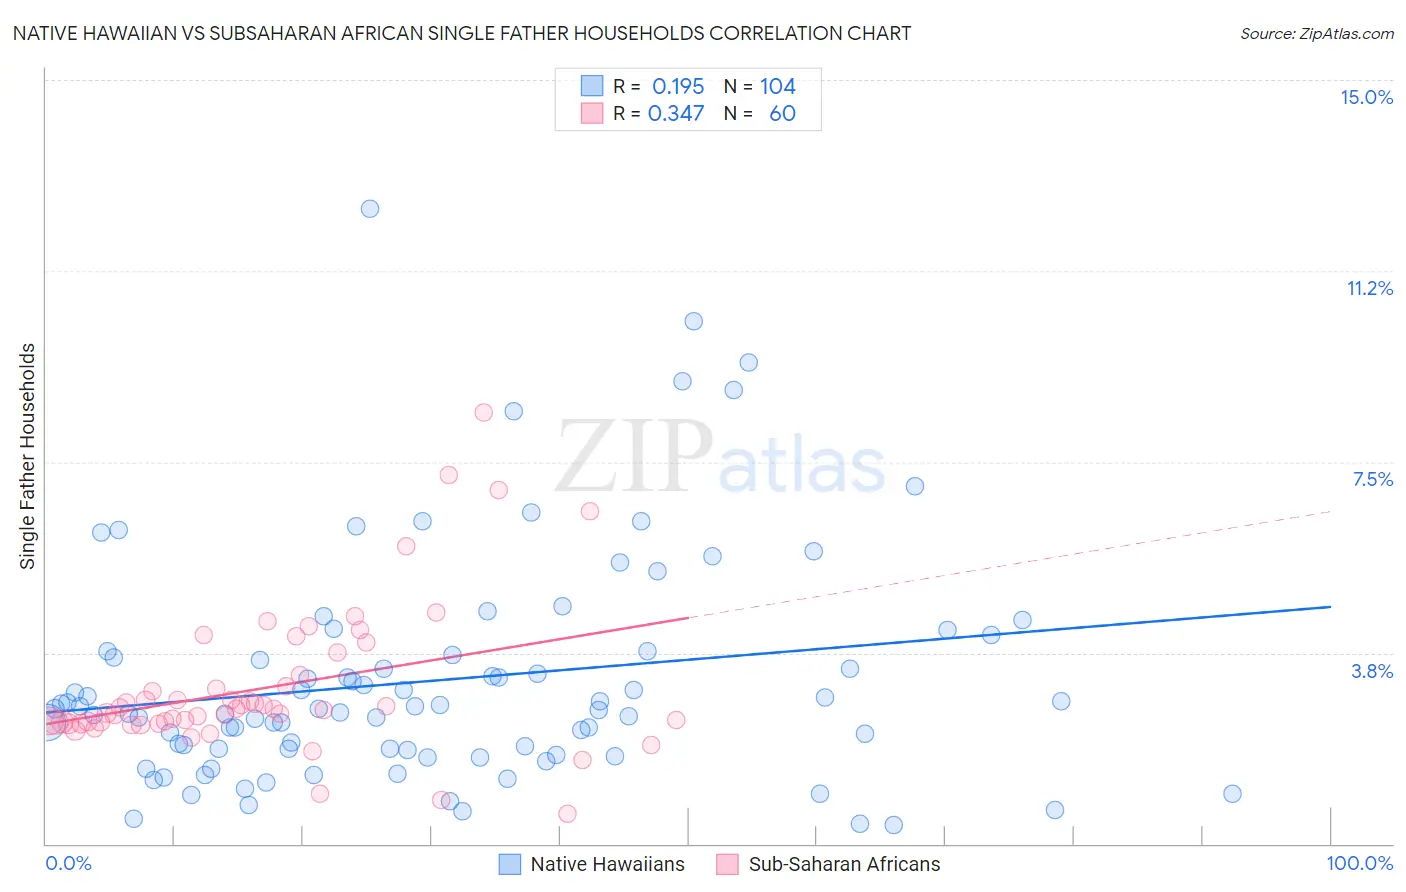
Native Hawaiian vs Subsaharan African Single Father Households Correlation Chart
The statistical analysis conducted on geographies consisting of 329,768,096 people shows a poor positive correlation between the proportion of Native Hawaiians and percentage of single father households in the United States with a correlation coefficient (R) of 0.195 and weighted average of 2.5%. Similarly, the statistical analysis conducted on geographies consisting of 500,994,896 people shows a mild positive correlation between the proportion of Sub-Saharan Africans and percentage of single father households in the United States with a correlation coefficient (R) of 0.347 and weighted average of 2.4%, a difference of 2.2%.
Single Father Households Correlation Summary
| Measurement | Native Hawaiian | Subsaharan African |
| Minimum | 0.37% | 0.60% |
| Maximum | 12.5% | 8.5% |
| Range | 12.1% | 7.9% |
| Mean | 3.2% | 3.1% |
| Median | 2.6% | 2.6% |
| Interquartile 25% (IQ1) | 1.8% | 2.4% |
| Interquartile 75% (IQ3) | 3.7% | 3.2% |
| Interquartile Range (IQR) | 1.9% | 0.83% |
| Standard Deviation (Sample) | 2.2% | 1.5% |
| Standard Deviation (Population) | 2.2% | 1.4% |
Demographics Similar to Native Hawaiians and Sub-Saharan Africans by Single Father Households
In terms of single father households, the demographic groups most similar to Native Hawaiians are Basque (2.5%, a difference of 0.020%), Delaware (2.5%, a difference of 0.020%), Bahamian (2.5%, a difference of 0.060%), Immigrants from Middle Africa (2.5%, a difference of 0.23%), and Spaniard (2.5%, a difference of 0.41%). Similarly, the demographic groups most similar to Sub-Saharan Africans are Immigrants from Zaire (2.4%, a difference of 0.090%), Nonimmigrants (2.4%, a difference of 0.16%), Immigrants from Ghana (2.4%, a difference of 0.20%), Pennsylvania German (2.4%, a difference of 0.25%), and Immigrants from Western Africa (2.4%, a difference of 0.30%).
| Demographics | Rating | Rank | Single Father Households |
| Immigrants | Ghana | 9.1 /100 | #228 | Tragic 2.4% |
| Immigrants | Zaire | 8.6 /100 | #229 | Tragic 2.4% |
| Sub-Saharan Africans | 8.3 /100 | #230 | Tragic 2.4% |
| Immigrants | Nonimmigrants | 7.6 /100 | #231 | Tragic 2.4% |
| Pennsylvania Germans | 7.3 /100 | #232 | Tragic 2.4% |
| Immigrants | Western Africa | 7.0 /100 | #233 | Tragic 2.4% |
| Africans | 6.3 /100 | #234 | Tragic 2.5% |
| Immigrants | Immigrants | 6.3 /100 | #235 | Tragic 2.5% |
| Cajuns | 6.1 /100 | #236 | Tragic 2.5% |
| Sierra Leoneans | 5.9 /100 | #237 | Tragic 2.5% |
| Immigrants | Sierra Leone | 5.8 /100 | #238 | Tragic 2.5% |
| Immigrants | Oceania | 5.8 /100 | #239 | Tragic 2.5% |
| Immigrants | Dominica | 4.8 /100 | #240 | Tragic 2.5% |
| Portuguese | 4.1 /100 | #241 | Tragic 2.5% |
| Osage | 4.1 /100 | #242 | Tragic 2.5% |
| Spaniards | 3.1 /100 | #243 | Tragic 2.5% |
| Immigrants | Middle Africa | 2.8 /100 | #244 | Tragic 2.5% |
| Basques | 2.5 /100 | #245 | Tragic 2.5% |
| Native Hawaiians | 2.5 /100 | #246 | Tragic 2.5% |
| Delaware | 2.5 /100 | #247 | Tragic 2.5% |
| Bahamians | 2.4 /100 | #248 | Tragic 2.5% |