Icelander vs Immigrants from Chile Single Father Households
COMPARE
Icelander
Immigrants from Chile
Single Father Households
Single Father Households Comparison
Icelanders
Immigrants from Chile
2.3%
SINGLE FATHER HOUSEHOLDS
63.1/ 100
METRIC RATING
168th/ 347
METRIC RANK
2.2%
SINGLE FATHER HOUSEHOLDS
96.7/ 100
METRIC RATING
130th/ 347
METRIC RANK
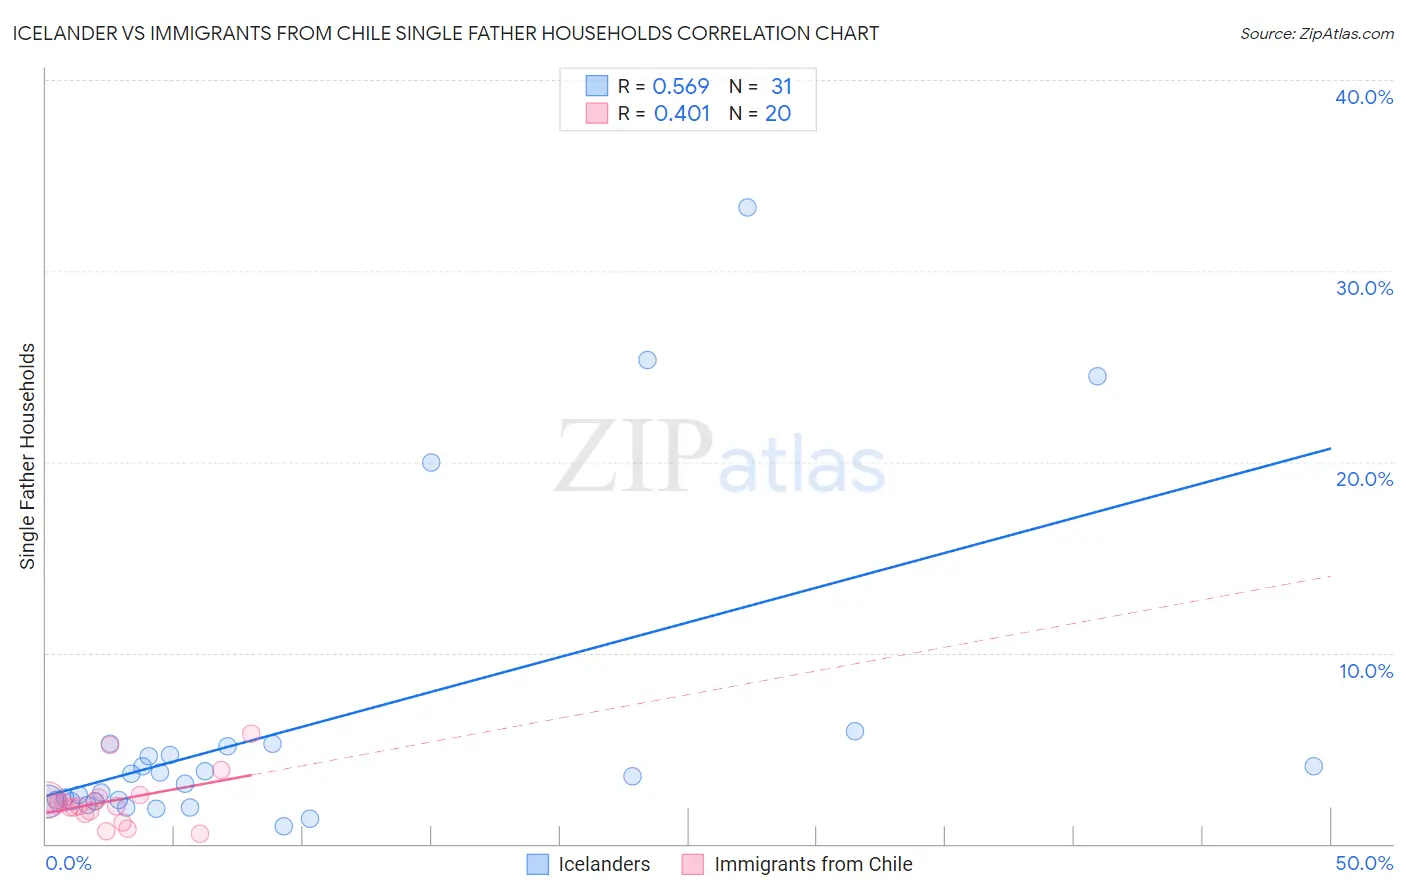
Icelander vs Immigrants from Chile Single Father Households Correlation Chart
The statistical analysis conducted on geographies consisting of 159,015,107 people shows a substantial positive correlation between the proportion of Icelanders and percentage of single father households in the United States with a correlation coefficient (R) of 0.569 and weighted average of 2.3%. Similarly, the statistical analysis conducted on geographies consisting of 217,839,905 people shows a moderate positive correlation between the proportion of Immigrants from Chile and percentage of single father households in the United States with a correlation coefficient (R) of 0.401 and weighted average of 2.2%, a difference of 5.5%.
Single Father Households Correlation Summary
| Measurement | Icelander | Immigrants from Chile |
| Minimum | 0.94% | 0.50% |
| Maximum | 33.3% | 5.8% |
| Range | 32.4% | 5.3% |
| Mean | 6.1% | 2.2% |
| Median | 3.5% | 2.0% |
| Interquartile 25% (IQ1) | 2.2% | 1.7% |
| Interquartile 75% (IQ3) | 5.1% | 2.3% |
| Interquartile Range (IQR) | 2.9% | 0.69% |
| Standard Deviation (Sample) | 8.0% | 1.3% |
| Standard Deviation (Population) | 7.9% | 1.3% |
Similar Demographics by Single Father Households
Demographics Similar to Icelanders by Single Father Households
In terms of single father households, the demographic groups most similar to Icelanders are Czech (2.3%, a difference of 0.040%), Ugandan (2.3%, a difference of 0.070%), South American (2.3%, a difference of 0.10%), Swedish (2.3%, a difference of 0.12%), and Czechoslovakian (2.3%, a difference of 0.33%).
| Demographics | Rating | Rank | Single Father Households |
| Swiss | 73.2 /100 | #161 | Good 2.3% |
| Scottish | 72.8 /100 | #162 | Good 2.3% |
| Irish | 72.1 /100 | #163 | Good 2.3% |
| Pakistanis | 70.6 /100 | #164 | Good 2.3% |
| Scotch-Irish | 69.4 /100 | #165 | Good 2.3% |
| English | 68.6 /100 | #166 | Good 2.3% |
| South Americans | 64.3 /100 | #167 | Good 2.3% |
| Icelanders | 63.1 /100 | #168 | Good 2.3% |
| Czechs | 62.5 /100 | #169 | Good 2.3% |
| Ugandans | 62.2 /100 | #170 | Good 2.3% |
| Swedes | 61.6 /100 | #171 | Good 2.3% |
| Czechoslovakians | 58.9 /100 | #172 | Average 2.3% |
| Celtics | 55.4 /100 | #173 | Average 2.3% |
| Afghans | 50.0 /100 | #174 | Average 2.3% |
| Immigrants | Jamaica | 49.1 /100 | #175 | Average 2.3% |
Demographics Similar to Immigrants from Chile by Single Father Households
In terms of single father households, the demographic groups most similar to Immigrants from Chile are Immigrants from Jordan (2.2%, a difference of 0.060%), Polish (2.2%, a difference of 0.070%), Serbian (2.2%, a difference of 0.11%), Immigrants from England (2.2%, a difference of 0.12%), and Moroccan (2.2%, a difference of 0.17%).
| Demographics | Rating | Rank | Single Father Households |
| Immigrants | Yemen | 97.5 /100 | #123 | Exceptional 2.2% |
| British West Indians | 97.4 /100 | #124 | Exceptional 2.2% |
| Immigrants | Indonesia | 97.4 /100 | #125 | Exceptional 2.2% |
| Moroccans | 96.9 /100 | #126 | Exceptional 2.2% |
| Jordanians | 96.9 /100 | #127 | Exceptional 2.2% |
| Immigrants | England | 96.8 /100 | #128 | Exceptional 2.2% |
| Serbians | 96.8 /100 | #129 | Exceptional 2.2% |
| Immigrants | Chile | 96.7 /100 | #130 | Exceptional 2.2% |
| Immigrants | Jordan | 96.6 /100 | #131 | Exceptional 2.2% |
| Poles | 96.5 /100 | #132 | Exceptional 2.2% |
| Taiwanese | 96.3 /100 | #133 | Exceptional 2.2% |
| Zimbabweans | 95.1 /100 | #134 | Exceptional 2.2% |
| Syrians | 94.8 /100 | #135 | Exceptional 2.2% |
| Chileans | 94.5 /100 | #136 | Exceptional 2.2% |
| Austrians | 94.2 /100 | #137 | Exceptional 2.2% |