British vs Immigrants from Belarus Seniors Poverty Over the Age of 65
COMPARE
British
Immigrants from Belarus
Seniors Poverty Over the Age of 65
Seniors Poverty Over the Age of 65 Comparison
British
Immigrants from Belarus
9.4%
SENIORS POVERTY OVER THE AGE OF 65
99.8/ 100
METRIC RATING
34th/ 347
METRIC RANK
11.8%
SENIORS POVERTY OVER THE AGE OF 65
3.2/ 100
METRIC RATING
225th/ 347
METRIC RANK
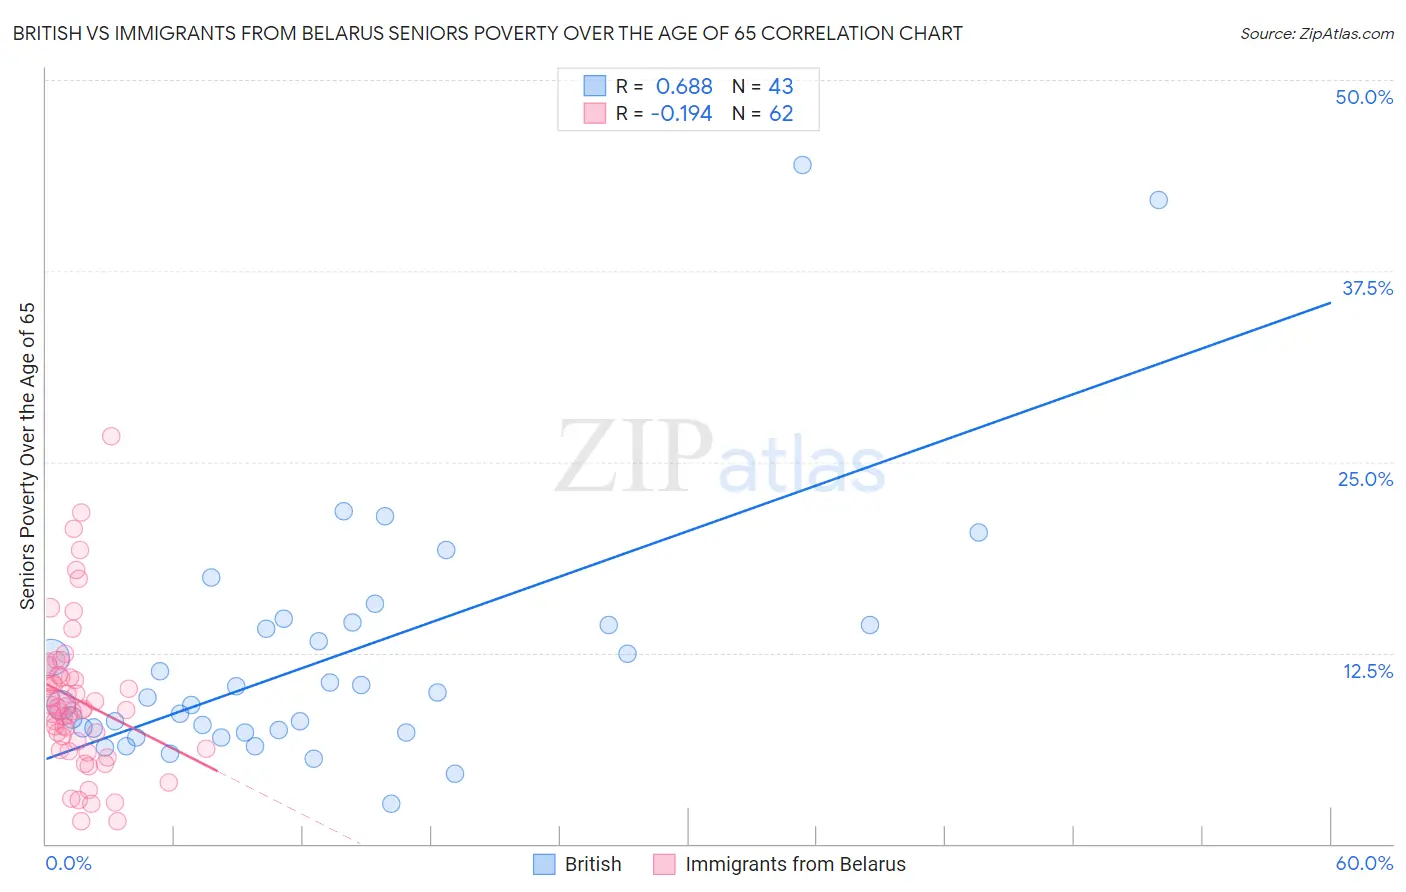
British vs Immigrants from Belarus Seniors Poverty Over the Age of 65 Correlation Chart
The statistical analysis conducted on geographies consisting of 527,868,961 people shows a significant positive correlation between the proportion of British and poverty level among seniors over the age of 65 in the United States with a correlation coefficient (R) of 0.688 and weighted average of 9.4%. Similarly, the statistical analysis conducted on geographies consisting of 149,998,733 people shows a poor negative correlation between the proportion of Immigrants from Belarus and poverty level among seniors over the age of 65 in the United States with a correlation coefficient (R) of -0.194 and weighted average of 11.8%, a difference of 24.9%.
Seniors Poverty Over the Age of 65 Correlation Summary
| Measurement | British | Immigrants from Belarus |
| Minimum | 2.6% | 1.5% |
| Maximum | 44.4% | 26.7% |
| Range | 41.8% | 25.2% |
| Mean | 12.1% | 9.4% |
| Median | 9.6% | 8.8% |
| Interquartile 25% (IQ1) | 7.3% | 6.2% |
| Interquartile 75% (IQ3) | 14.3% | 10.9% |
| Interquartile Range (IQR) | 7.1% | 4.6% |
| Standard Deviation (Sample) | 8.3% | 4.9% |
| Standard Deviation (Population) | 8.2% | 4.8% |
Similar Demographics by Seniors Poverty Over the Age of 65
Demographics Similar to British by Seniors Poverty Over the Age of 65
In terms of seniors poverty over the age of 65, the demographic groups most similar to British are Native Hawaiian (9.4%, a difference of 0.10%), Northern European (9.4%, a difference of 0.12%), Latvian (9.5%, a difference of 0.38%), Finnish (9.4%, a difference of 0.40%), and Czechoslovakian (9.5%, a difference of 0.43%).
| Demographics | Rating | Rank | Seniors Poverty Over the Age of 65 |
| Italians | 99.9 /100 | #27 | Exceptional 9.3% |
| Tongans | 99.9 /100 | #28 | Exceptional 9.3% |
| Bhutanese | 99.9 /100 | #29 | Exceptional 9.3% |
| Menominee | 99.8 /100 | #30 | Exceptional 9.4% |
| Finns | 99.8 /100 | #31 | Exceptional 9.4% |
| Northern Europeans | 99.8 /100 | #32 | Exceptional 9.4% |
| Native Hawaiians | 99.8 /100 | #33 | Exceptional 9.4% |
| British | 99.8 /100 | #34 | Exceptional 9.4% |
| Latvians | 99.8 /100 | #35 | Exceptional 9.5% |
| Czechoslovakians | 99.8 /100 | #36 | Exceptional 9.5% |
| Scotch-Irish | 99.7 /100 | #37 | Exceptional 9.5% |
| Belgians | 99.7 /100 | #38 | Exceptional 9.5% |
| Greeks | 99.6 /100 | #39 | Exceptional 9.6% |
| Assyrians/Chaldeans/Syriacs | 99.6 /100 | #40 | Exceptional 9.6% |
| Immigrants | North Macedonia | 99.6 /100 | #41 | Exceptional 9.6% |
Demographics Similar to Immigrants from Belarus by Seniors Poverty Over the Age of 65
In terms of seniors poverty over the age of 65, the demographic groups most similar to Immigrants from Belarus are Liberian (11.8%, a difference of 0.020%), Nigerian (11.8%, a difference of 0.060%), Immigrants from Nigeria (11.7%, a difference of 0.10%), Immigrants from Congo (11.7%, a difference of 0.34%), and Immigrants from Chile (11.7%, a difference of 0.38%).
| Demographics | Rating | Rank | Seniors Poverty Over the Age of 65 |
| Immigrants | Ukraine | 5.7 /100 | #218 | Tragic 11.6% |
| Arapaho | 5.2 /100 | #219 | Tragic 11.6% |
| Peruvians | 4.2 /100 | #220 | Tragic 11.7% |
| Argentineans | 4.1 /100 | #221 | Tragic 11.7% |
| Immigrants | Chile | 3.9 /100 | #222 | Tragic 11.7% |
| Immigrants | Congo | 3.8 /100 | #223 | Tragic 11.7% |
| Immigrants | Nigeria | 3.4 /100 | #224 | Tragic 11.7% |
| Immigrants | Belarus | 3.2 /100 | #225 | Tragic 11.8% |
| Liberians | 3.2 /100 | #226 | Tragic 11.8% |
| Nigerians | 3.2 /100 | #227 | Tragic 11.8% |
| Immigrants | Costa Rica | 2.7 /100 | #228 | Tragic 11.8% |
| Immigrants | Eritrea | 2.6 /100 | #229 | Tragic 11.8% |
| Bermudans | 2.1 /100 | #230 | Tragic 11.9% |
| Cajuns | 2.0 /100 | #231 | Tragic 11.9% |
| Yaqui | 1.9 /100 | #232 | Tragic 11.9% |