British vs Immigrants from Belarus Median Female Earnings
COMPARE
British
Immigrants from Belarus
Median Female Earnings
Median Female Earnings Comparison
British
Immigrants from Belarus
$39,772
MEDIAN FEMALE EARNINGS
53.8/ 100
METRIC RATING
172nd/ 347
METRIC RANK
$44,757
MEDIAN FEMALE EARNINGS
100.0/ 100
METRIC RATING
26th/ 347
METRIC RANK
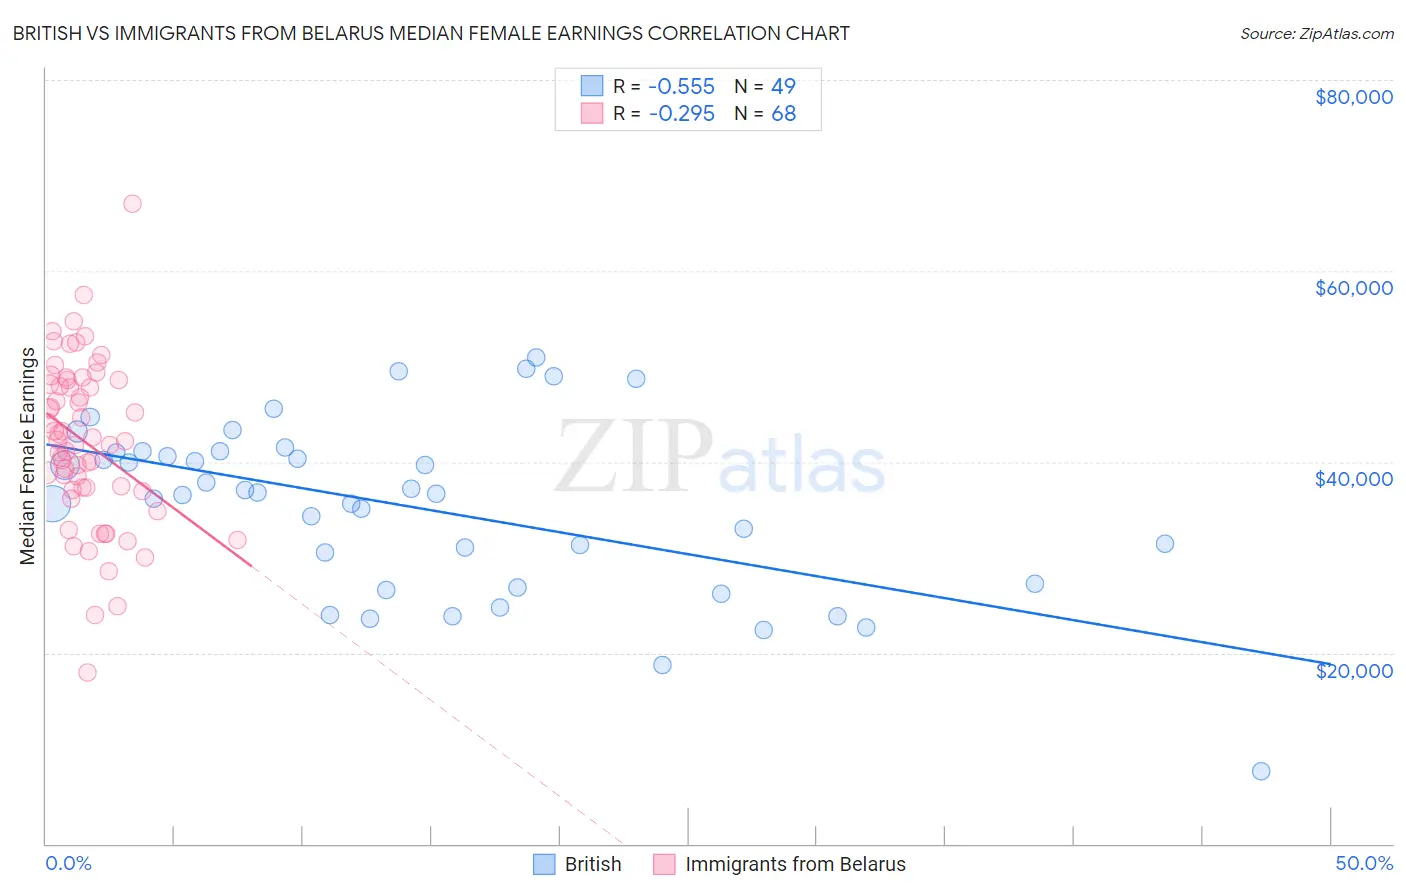
British vs Immigrants from Belarus Median Female Earnings Correlation Chart
The statistical analysis conducted on geographies consisting of 530,644,409 people shows a substantial negative correlation between the proportion of British and median female earnings in the United States with a correlation coefficient (R) of -0.555 and weighted average of $39,772. Similarly, the statistical analysis conducted on geographies consisting of 150,178,879 people shows a weak negative correlation between the proportion of Immigrants from Belarus and median female earnings in the United States with a correlation coefficient (R) of -0.295 and weighted average of $44,757, a difference of 12.5%.
Median Female Earnings Correlation Summary
| Measurement | British | Immigrants from Belarus |
| Minimum | $7,631 | $17,969 |
| Maximum | $50,972 | $67,083 |
| Range | $43,341 | $49,114 |
| Mean | $35,190 | $42,072 |
| Median | $36,667 | $42,243 |
| Interquartile 25% (IQ1) | $27,044 | $37,178 |
| Interquartile 75% (IQ3) | $41,037 | $48,362 |
| Interquartile Range (IQR) | $13,994 | $11,183 |
| Standard Deviation (Sample) | $9,173 | $8,617 |
| Standard Deviation (Population) | $9,079 | $8,553 |
Similar Demographics by Median Female Earnings
Demographics Similar to British by Median Female Earnings
In terms of median female earnings, the demographic groups most similar to British are Immigrants from Portugal ($39,788, a difference of 0.040%), Slovene ($39,817, a difference of 0.11%), Canadian ($39,724, a difference of 0.12%), South American ($39,698, a difference of 0.19%), and Kenyan ($39,860, a difference of 0.22%).
| Demographics | Rating | Rank | Median Female Earnings |
| Immigrants | Bangladesh | 60.8 /100 | #165 | Good $39,910 |
| Immigrants | Ghana | 60.0 /100 | #166 | Good $39,894 |
| Luxembourgers | 59.9 /100 | #167 | Average $39,891 |
| Immigrants | Peru | 58.9 /100 | #168 | Average $39,871 |
| Kenyans | 58.4 /100 | #169 | Average $39,860 |
| Slovenes | 56.2 /100 | #170 | Average $39,817 |
| Immigrants | Portugal | 54.7 /100 | #171 | Average $39,788 |
| British | 53.8 /100 | #172 | Average $39,772 |
| Canadians | 51.4 /100 | #173 | Average $39,724 |
| South Americans | 50.0 /100 | #174 | Average $39,698 |
| Immigrants | South America | 47.2 /100 | #175 | Average $39,643 |
| Nigerians | 47.0 /100 | #176 | Average $39,641 |
| Costa Ricans | 46.1 /100 | #177 | Average $39,622 |
| Slavs | 45.6 /100 | #178 | Average $39,613 |
| Immigrants | Germany | 45.1 /100 | #179 | Average $39,603 |
Demographics Similar to Immigrants from Belarus by Median Female Earnings
In terms of median female earnings, the demographic groups most similar to Immigrants from Belarus are Immigrants from Sweden ($44,774, a difference of 0.040%), Turkish ($44,695, a difference of 0.14%), Immigrants from Russia ($44,680, a difference of 0.17%), Immigrants from Korea ($44,847, a difference of 0.20%), and Burmese ($44,911, a difference of 0.34%).
| Demographics | Rating | Rank | Median Female Earnings |
| Eastern Europeans | 100.0 /100 | #19 | Exceptional $45,385 |
| Immigrants | Japan | 100.0 /100 | #20 | Exceptional $45,323 |
| Cambodians | 100.0 /100 | #21 | Exceptional $45,014 |
| Immigrants | Greece | 100.0 /100 | #22 | Exceptional $44,976 |
| Burmese | 100.0 /100 | #23 | Exceptional $44,911 |
| Immigrants | Korea | 100.0 /100 | #24 | Exceptional $44,847 |
| Immigrants | Sweden | 100.0 /100 | #25 | Exceptional $44,774 |
| Immigrants | Belarus | 100.0 /100 | #26 | Exceptional $44,757 |
| Turks | 100.0 /100 | #27 | Exceptional $44,695 |
| Immigrants | Russia | 100.0 /100 | #28 | Exceptional $44,680 |
| Immigrants | Belgium | 100.0 /100 | #29 | Exceptional $44,587 |
| Asians | 100.0 /100 | #30 | Exceptional $44,586 |
| Immigrants | France | 100.0 /100 | #31 | Exceptional $44,541 |
| Immigrants | Northern Europe | 100.0 /100 | #32 | Exceptional $44,366 |
| Immigrants | Asia | 100.0 /100 | #33 | Exceptional $44,198 |