British vs Comanche Professional Degree
COMPARE
British
Comanche
Professional Degree
Professional Degree Comparison
British
Comanche
5.0%
PROFESSIONAL DEGREE
98.0/ 100
METRIC RATING
109th/ 347
METRIC RANK
3.5%
PROFESSIONAL DEGREE
0.4/ 100
METRIC RATING
283rd/ 347
METRIC RANK
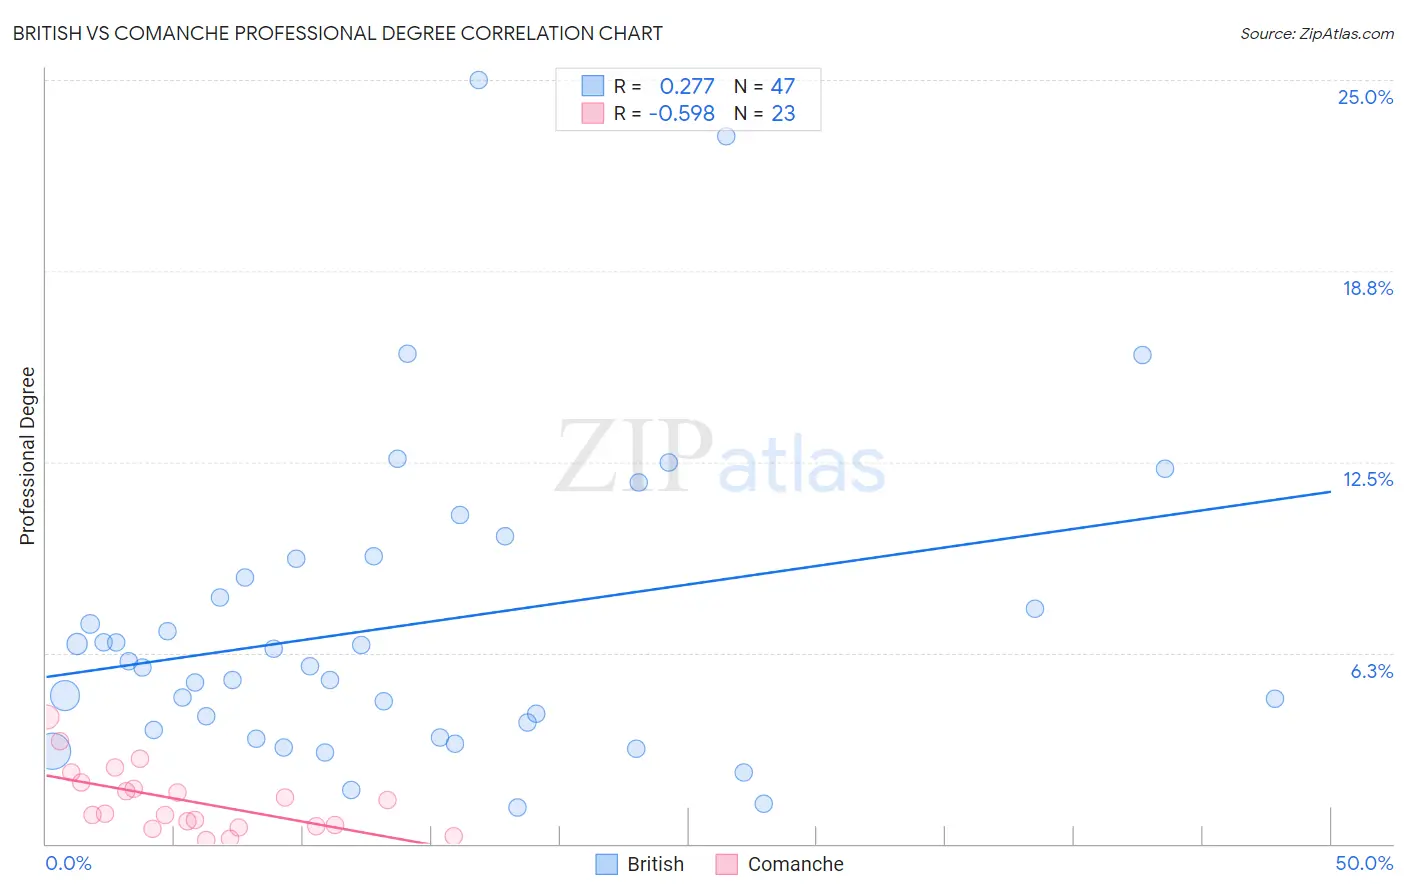
British vs Comanche Professional Degree Correlation Chart
The statistical analysis conducted on geographies consisting of 527,483,146 people shows a weak positive correlation between the proportion of British and percentage of population with at least professional degree education in the United States with a correlation coefficient (R) of 0.277 and weighted average of 5.0%. Similarly, the statistical analysis conducted on geographies consisting of 109,559,847 people shows a substantial negative correlation between the proportion of Comanche and percentage of population with at least professional degree education in the United States with a correlation coefficient (R) of -0.598 and weighted average of 3.5%, a difference of 42.5%.
Professional Degree Correlation Summary
| Measurement | British | Comanche |
| Minimum | 1.2% | 0.11% |
| Maximum | 25.0% | 4.1% |
| Range | 23.8% | 4.0% |
| Mean | 7.2% | 1.4% |
| Median | 5.8% | 0.97% |
| Interquartile 25% (IQ1) | 3.7% | 0.57% |
| Interquartile 75% (IQ3) | 9.3% | 2.0% |
| Interquartile Range (IQR) | 5.6% | 1.4% |
| Standard Deviation (Sample) | 5.1% | 1.1% |
| Standard Deviation (Population) | 5.0% | 1.0% |
Similar Demographics by Professional Degree
Demographics Similar to British by Professional Degree
In terms of professional degree, the demographic groups most similar to British are Immigrants from Southern Europe (5.0%, a difference of 0.020%), Maltese (5.0%, a difference of 0.060%), Lebanese (5.0%, a difference of 0.15%), Immigrants from Ukraine (5.0%, a difference of 0.18%), and Immigrants from Uganda (5.0%, a difference of 0.21%).
| Demographics | Rating | Rank | Professional Degree |
| Ukrainians | 98.5 /100 | #102 | Exceptional 5.1% |
| Immigrants | Northern Africa | 98.4 /100 | #103 | Exceptional 5.1% |
| Arabs | 98.2 /100 | #104 | Exceptional 5.0% |
| Immigrants | Uganda | 98.2 /100 | #105 | Exceptional 5.0% |
| Immigrants | Ukraine | 98.2 /100 | #106 | Exceptional 5.0% |
| Maltese | 98.1 /100 | #107 | Exceptional 5.0% |
| Immigrants | Southern Europe | 98.1 /100 | #108 | Exceptional 5.0% |
| British | 98.0 /100 | #109 | Exceptional 5.0% |
| Lebanese | 98.0 /100 | #110 | Exceptional 5.0% |
| Brazilians | 97.4 /100 | #111 | Exceptional 5.0% |
| Taiwanese | 97.3 /100 | #112 | Exceptional 5.0% |
| Immigrants | Pakistan | 97.2 /100 | #113 | Exceptional 5.0% |
| Immigrants | Morocco | 96.8 /100 | #114 | Exceptional 5.0% |
| Moroccans | 96.8 /100 | #115 | Exceptional 5.0% |
| Venezuelans | 96.3 /100 | #116 | Exceptional 4.9% |
Demographics Similar to Comanche by Professional Degree
In terms of professional degree, the demographic groups most similar to Comanche are Salvadoran (3.5%, a difference of 0.10%), Immigrants from Caribbean (3.5%, a difference of 0.30%), Apache (3.5%, a difference of 0.32%), Dominican (3.5%, a difference of 0.34%), and Immigrants from Portugal (3.5%, a difference of 0.38%).
| Demographics | Rating | Rank | Professional Degree |
| Liberians | 0.5 /100 | #276 | Tragic 3.6% |
| Cheyenne | 0.5 /100 | #277 | Tragic 3.6% |
| Japanese | 0.5 /100 | #278 | Tragic 3.5% |
| Immigrants | Portugal | 0.5 /100 | #279 | Tragic 3.5% |
| Dominicans | 0.5 /100 | #280 | Tragic 3.5% |
| Apache | 0.5 /100 | #281 | Tragic 3.5% |
| Immigrants | Caribbean | 0.5 /100 | #282 | Tragic 3.5% |
| Comanche | 0.4 /100 | #283 | Tragic 3.5% |
| Salvadorans | 0.4 /100 | #284 | Tragic 3.5% |
| Hondurans | 0.3 /100 | #285 | Tragic 3.5% |
| Haitians | 0.3 /100 | #286 | Tragic 3.5% |
| Immigrants | El Salvador | 0.3 /100 | #287 | Tragic 3.5% |
| Blackfeet | 0.3 /100 | #288 | Tragic 3.5% |
| Guatemalans | 0.3 /100 | #289 | Tragic 3.5% |
| Chippewa | 0.3 /100 | #290 | Tragic 3.5% |