Bolivian vs Marshallese Single Father Households

COMPARE

Bolivian
Race
Ancestry
AfghanAfricanAlaska NativeAlaskan AthabascanAlbanianAleutAlsatianAmericanApacheArabArapahoArgentineanArmenianAssyrian/Chaldean/SyriacAustralianAustrianBahamianBangladeshiBarbadianBasqueBelgianBelizeanBermudanBhutaneseBlackfeetBolivianBrazilianBritishBritish West IndianBulgarianBurmeseCajunCambodianCanadianCape VerdeanCarpatho RusynCelticCentral AmericanCentral American IndianCherokeeCheyenneChickasawChileanChineseChippewaChoctawColombianColvilleComancheCosta RicanCreeCreekCroatianCrowCubanCypriotCzechCzechoslovakianDanishDelawareDominicanDutchDutch West IndianEastern EuropeanEcuadorianEgyptianEnglishEstonianEthiopianEuropeanFijianFilipinoFinnishFrenchFrench American IndianFrench CanadianGermanGerman RussianGhanaianGreekGuamanian/ChamorroGuatemalanGuyaneseHaitianHmongHonduranHopiHoumaHungarianIcelanderIndian (Asian)IndonesianInupiatIranianIraqiIrishIroquoisIsraeliItalianJamaicanJapaneseJordanianKenyanKiowaKoreanLaotianLatvianLebaneseLiberianLithuanianLumbeeLuxembourgerMacedonianMalaysianMalteseMenomineeMexicanMexican American IndianMongolianMoroccanNative HawaiianNavajoNepaleseNew ZealanderNicaraguanNigerianNorthern EuropeanNorwegianOkinawanOsageOttawaPaiutePakistaniPalestinianPanamanianParaguayanPennsylvania GermanPeruvianPimaPolishPortuguesePotawatomiPuebloPuerto RicanPuget Sound SalishRomanianRussianSalvadoranSamoanScandinavianScotch-IrishScottishSeminoleSenegaleseSerbianShoshoneSierra LeoneanSiouxSlavicSlovakSloveneSomaliSouth AfricanSouth AmericanSouth American IndianSoviet UnionSpaniardSpanishSpanish AmericanSpanish American IndianSri LankanSubsaharan AfricanSudaneseSwedishSwissSyrianTaiwaneseThaiTlingit-HaidaTohono O'OdhamTonganTrinidadian and TobagonianTsimshianTurkishU.S. Virgin IslanderUgandanUkrainianUruguayanUteVenezuelanVietnameseWelshWest IndianYakamaYaquiYugoslavianYumanYup'ikZimbabwean
Immigration
NonimmigrantsImmigrantsAfghanistanAfricaAlbaniaArgentinaArmeniaAsiaAustraliaAustriaBahamasBangladeshBarbadosBelarusBelgiumBelizeBoliviaBosnia and HerzegovinaBrazilBulgariaBurma/MyanmarCabo VerdeCambodiaCameroonCanadaCaribbeanCentral AmericaChileChinaColombiaCongoCosta RicaCroatiaCubaCzechoslovakiaDenmarkDominicaDominican RepublicEastern AfricaEastern AsiaEastern EuropeEcuadorEgyptEl SalvadorEnglandEritreaEthiopiaEuropeFijiFranceGermanyGhanaGreeceGrenadaGuatemalaGuyanaHaitiHondurasHong KongHungaryIndiaIndonesiaIranIraqIrelandIsraelItalyJamaicaJapanJordanKazakhstanKenyaKoreaKuwaitLaosLatin AmericaLatviaLebanonLiberiaLithuaniaMalaysiaMexicoMicronesiaMiddle AfricaMoldovaMoroccoNepalNetherlandsNicaraguaNigeriaNorth AmericaNorth MacedoniaNorthern AfricaNorthern EuropeNorwayOceaniaPakistanPanamaPeruPhilippinesPolandPortugalRomaniaRussiaSaudi ArabiaScotlandSenegalSerbiaSierra LeoneSingaporeSomaliaSouth AfricaSouth AmericaSouth Central AsiaSouth Eastern AsiaSouthern EuropeSpainSri LankaSt. Vincent and the GrenadinesSudanSwedenSwitzerlandSyriaTaiwanThailandTrinidad and TobagoTurkeyUgandaUkraineUruguayUzbekistanVenezuelaVietnamWest IndiesWestern AfricaWestern AsiaWestern EuropeYemenZaireZimbabweAzores
Marshallese
Race
Ancestry
AfghanAfricanAlaska NativeAlaskan AthabascanAlbanianAleutAlsatianAmericanApacheArabArapahoArgentineanArmenianAssyrian/Chaldean/SyriacAustralianAustrianBahamianBangladeshiBarbadianBasqueBelgianBelizeanBermudanBhutaneseBlackfeetBrazilianBritishBritish West IndianBulgarianBurmeseCajunCambodianCanadianCape VerdeanCarpatho RusynCelticCentral AmericanCentral American IndianCherokeeCheyenneChickasawChileanChineseChippewaChoctawColombianColvilleComancheCosta RicanCreeCreekCroatianCrowCubanCypriotCzechCzechoslovakianDanishDelawareDominicanDutchDutch West IndianEastern EuropeanEcuadorianEgyptianEnglishEstonianEthiopianEuropeanFijianFilipinoFinnishFrenchFrench American IndianFrench CanadianGermanGerman RussianGhanaianGreekGuamanian/ChamorroGuatemalanGuyaneseHaitianHmongHonduranHopiHoumaHungarianIcelanderIndian (Asian)IndonesianInupiatIranianIraqiIrishIroquoisIsraeliItalianJamaicanJapaneseJordanianKenyanKiowaKoreanLaotianLatvianLebaneseLiberianLithuanianLumbeeLuxembourgerMacedonianMalaysianMalteseMarshalleseMenomineeMexicanMexican American IndianMongolianMoroccanNative HawaiianNavajoNepaleseNew ZealanderNicaraguanNigerianNorthern EuropeanNorwegianOkinawanOsageOttawaPaiutePakistaniPalestinianPanamanianParaguayanPennsylvania GermanPeruvianPimaPolishPortuguesePotawatomiPuebloPuerto RicanPuget Sound SalishRomanianRussianSalvadoranSamoanScandinavianScotch-IrishScottishSeminoleSenegaleseSerbianShoshoneSierra LeoneanSiouxSlavicSlovakSloveneSomaliSouth AfricanSouth AmericanSouth American IndianSoviet UnionSpaniardSpanishSpanish AmericanSpanish American IndianSri LankanSubsaharan AfricanSudaneseSwedishSwissSyrianTaiwaneseThaiTlingit-HaidaTohono O'OdhamTonganTrinidadian and TobagonianTsimshianTurkishU.S. Virgin IslanderUgandanUkrainianUruguayanUteVenezuelanVietnameseWelshWest IndianYakamaYaquiYugoslavianYumanYup'ikZimbabwean
Immigration
NonimmigrantsImmigrantsAfghanistanAfricaAlbaniaArgentinaArmeniaAsiaAustraliaAustriaBahamasBangladeshBarbadosBelarusBelgiumBelizeBoliviaBosnia and HerzegovinaBrazilBulgariaBurma/MyanmarCabo VerdeCambodiaCameroonCanadaCaribbeanCentral AmericaChileChinaColombiaCongoCosta RicaCroatiaCubaCzechoslovakiaDenmarkDominicaDominican RepublicEastern AfricaEastern AsiaEastern EuropeEcuadorEgyptEl SalvadorEnglandEritreaEthiopiaEuropeFijiFranceGermanyGhanaGreeceGrenadaGuatemalaGuyanaHaitiHondurasHong KongHungaryIndiaIndonesiaIranIraqIrelandIsraelItalyJamaicaJapanJordanKazakhstanKenyaKoreaKuwaitLaosLatin AmericaLatviaLebanonLiberiaLithuaniaMalaysiaMexicoMicronesiaMiddle AfricaMoldovaMoroccoNepalNetherlandsNicaraguaNigeriaNorth AmericaNorth MacedoniaNorthern AfricaNorthern EuropeNorwayOceaniaPakistanPanamaPeruPhilippinesPolandPortugalRomaniaRussiaSaudi ArabiaScotlandSenegalSerbiaSierra LeoneSingaporeSomaliaSouth AfricaSouth AmericaSouth Central AsiaSouth Eastern AsiaSouthern EuropeSpainSri LankaSt. Vincent and the GrenadinesSudanSwedenSwitzerlandSyriaTaiwanThailandTrinidad and TobagoTurkeyUgandaUkraineUruguayUzbekistanVenezuelaVietnamWest IndiesWestern AfricaWestern AsiaWestern EuropeYemenZaireZimbabweAzores
Single Father Households
Income
Poverty
Unemployment
Labor Participation
Family Structure
Vehicle Availability
Education Level
Disability

Single Father Households Comparison

Bolivians

Marshallese

Excellent
Tragic
2.3%
SINGLE FATHER HOUSEHOLDS
81.0/ 100
METRIC RATING
154th/ 347
METRIC RANK
2.4%
SINGLE FATHER HOUSEHOLDS
9.7/ 100
METRIC RATING
225th/ 347
METRIC RANK

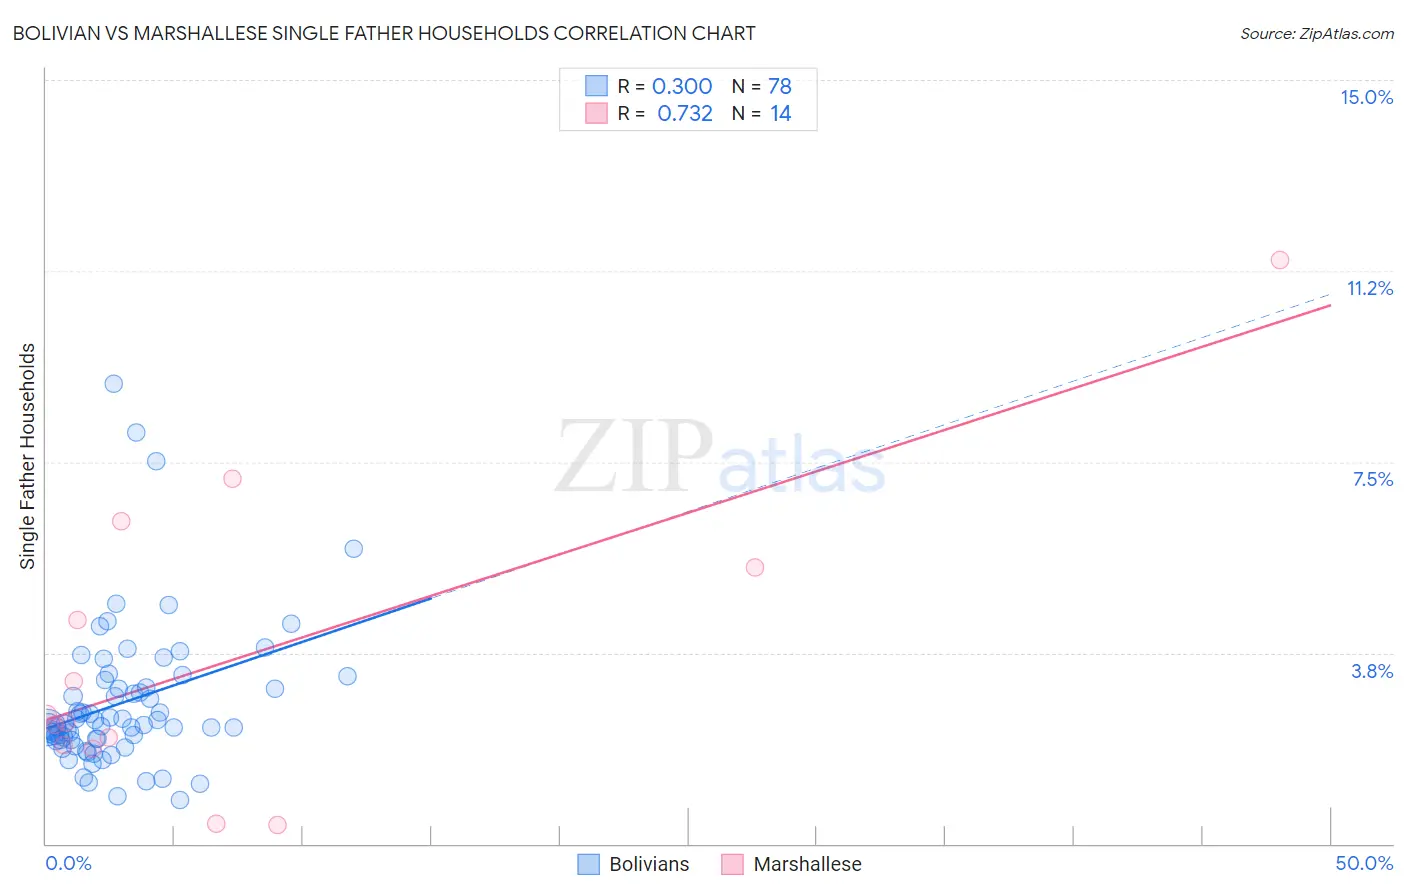
Bolivian vs Marshallese Single Father Households Correlation Chart

The statistical analysis conducted on geographies consisting of 184,110,694 people shows a mild positive correlation between the proportion of Bolivians and percentage of single father households in the United States with a correlation coefficient (R) of 0.300 and weighted average of 2.3%. Similarly, the statistical analysis conducted on geographies consisting of 14,759,622 people shows a strong positive correlation between the proportion of Marshallese and percentage of single father households in the United States with a correlation coefficient (R) of 0.732 and weighted average of 2.4%, a difference of 7.0%.
Bolivian vs Marshallese Single Father Households

Single Father Households Correlation Summary

MeasurementBolivianMarshallese
Minimum0.87%0.37%
Maximum9.0%11.5%
Range8.2%11.1%
Mean2.8%3.7%
Median2.3%2.5%
Interquartile 25% (IQ1)2.0%1.9%
Interquartile 75% (IQ3)3.1%5.4%
Interquartile Range (IQR)1.0%3.5%
Standard Deviation (Sample)1.4%3.0%
Standard Deviation (Population)1.4%2.9%

Similar Demographics by Single Father Households

Demographics Similar to Bolivians by Single Father Households

In terms of single father households, the demographic groups most similar to Bolivians are European (2.3%, a difference of 0.020%), Immigrants from South America (2.3%, a difference of 0.14%), Canadian (2.3%, a difference of 0.16%), Immigrants from Senegal (2.3%, a difference of 0.19%), and Immigrants from Germany (2.3%, a difference of 0.22%).
DemographicsRating | RankSingle Father Households
Slavs
88.9
/100
|
#147
Excellent
2.2%
South American Indians
88.5
/100
|
#148
Excellent
2.3%
Senegalese
88.4
/100
|
#149
Excellent
2.3%
Venezuelans
86.2
/100
|
#150
Excellent
2.3%
Immigrants | Syria
84.8
/100
|
#151
Excellent
2.3%
Immigrants | Venezuela
83.2
/100
|
#152
Excellent
2.3%
Immigrants | Germany
82.8
/100
|
#153
Excellent
2.3%
Bolivians
81.0
/100
|
#154
Excellent
2.3%
Europeans
80.9
/100
|
#155
Excellent
2.3%
Immigrants | South America
79.9
/100
|
#156
Good
2.3%
Canadians
79.7
/100
|
#157
Good
2.3%
Immigrants | Senegal
79.4
/100
|
#158
Good
2.3%
Immigrants | West Indies
77.9
/100
|
#159
Good
2.3%
Immigrants | Bolivia
76.3
/100
|
#160
Good
2.3%
Swiss
73.2
/100
|
#161
Good
2.3%

Demographics Similar to Marshallese by Single Father Households

In terms of single father households, the demographic groups most similar to Marshallese are Black/African American (2.4%, a difference of 0.010%), American (2.4%, a difference of 0.080%), Immigrants from Ghana (2.4%, a difference of 0.12%), Immigrants from Bahamas (2.4%, a difference of 0.17%), and Immigrants from Zaire (2.4%, a difference of 0.23%).
DemographicsRating | RankSingle Father Households
Immigrants | Ethiopia
13.4
/100
|
#218
Poor
2.4%
Sudanese
13.0
/100
|
#219
Poor
2.4%
Ghanaians
12.9
/100
|
#220
Poor
2.4%
Immigrants | Burma/Myanmar
12.1
/100
|
#221
Poor
2.4%
Immigrants | Eastern Africa
11.9
/100
|
#222
Poor
2.4%
Immigrants | Uruguay
11.0
/100
|
#223
Poor
2.4%
Immigrants | Bahamas
10.6
/100
|
#224
Poor
2.4%
Marshallese
9.7
/100
|
#225
Tragic
2.4%
Blacks/African Americans
9.7
/100
|
#226
Tragic
2.4%
Americans
9.3
/100
|
#227
Tragic
2.4%
Immigrants | Ghana
9.1
/100
|
#228
Tragic
2.4%
Immigrants | Zaire
8.6
/100
|
#229
Tragic
2.4%
Sub-Saharan Africans
8.3
/100
|
#230
Tragic
2.4%
Immigrants | Nonimmigrants
7.6
/100
|
#231
Tragic
2.4%
Pennsylvania Germans
7.3
/100
|
#232
Tragic
2.4%