Bolivian vs Immigrants from Indonesia Median Female Earnings
COMPARE
Bolivian
Immigrants from Indonesia
Median Female Earnings
Median Female Earnings Comparison
Bolivians
Immigrants from Indonesia
$43,445
MEDIAN FEMALE EARNINGS
100.0/ 100
METRIC RATING
47th/ 347
METRIC RANK
$43,412
MEDIAN FEMALE EARNINGS
100.0/ 100
METRIC RATING
48th/ 347
METRIC RANK
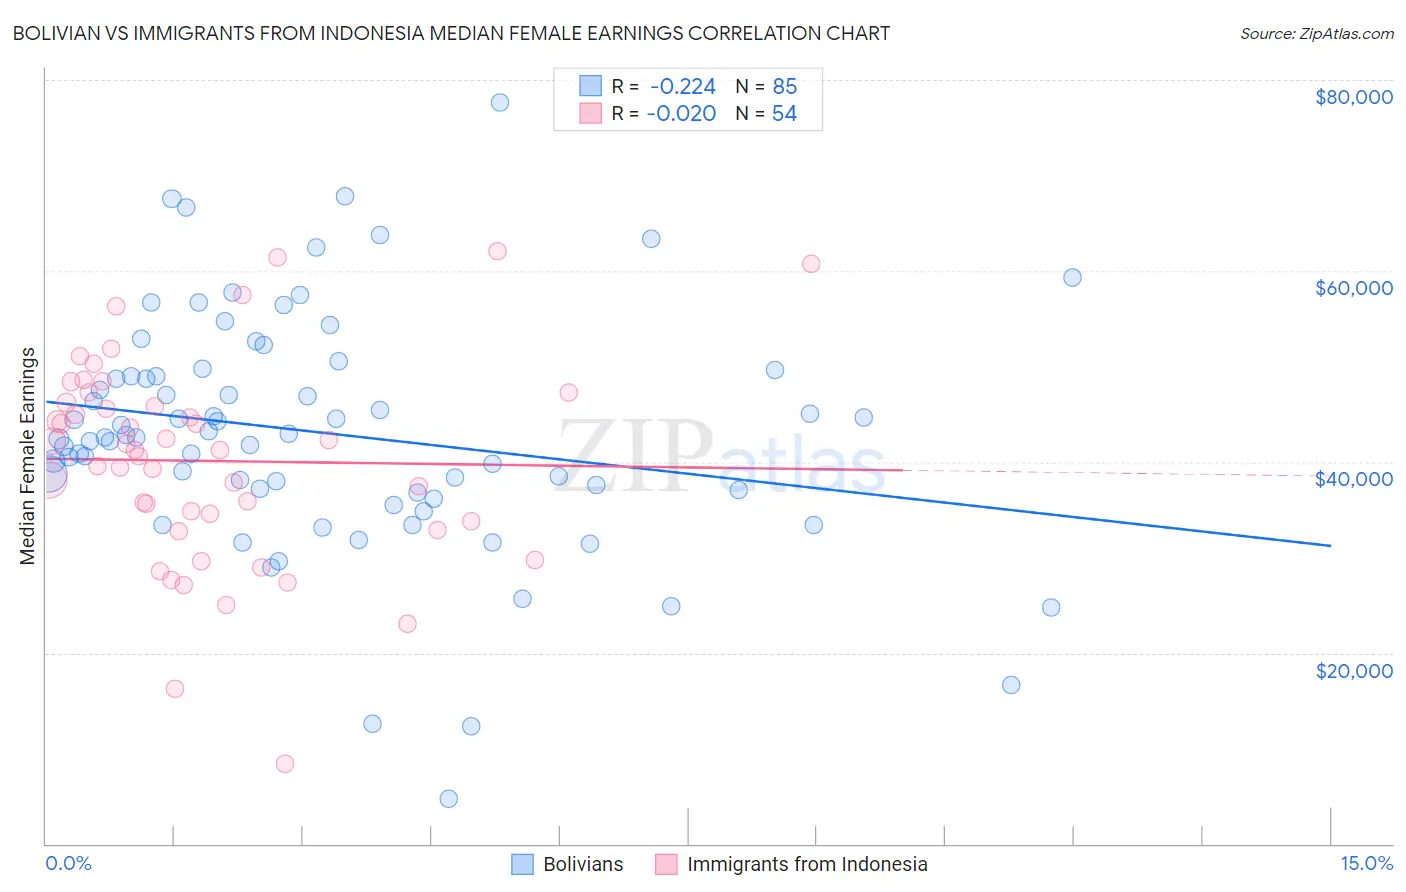
Bolivian vs Immigrants from Indonesia Median Female Earnings Correlation Chart
The statistical analysis conducted on geographies consisting of 184,667,503 people shows a weak negative correlation between the proportion of Bolivians and median female earnings in the United States with a correlation coefficient (R) of -0.224 and weighted average of $43,445. Similarly, the statistical analysis conducted on geographies consisting of 215,754,485 people shows no correlation between the proportion of Immigrants from Indonesia and median female earnings in the United States with a correlation coefficient (R) of -0.020 and weighted average of $43,412, a difference of 0.070%.
Median Female Earnings Correlation Summary
| Measurement | Bolivian | Immigrants from Indonesia |
| Minimum | $4,682 | $8,380 |
| Maximum | $77,679 | $62,036 |
| Range | $72,997 | $53,656 |
| Mean | $42,989 | $40,096 |
| Median | $42,606 | $41,238 |
| Interquartile 25% (IQ1) | $36,934 | $33,750 |
| Interquartile 75% (IQ3) | $49,332 | $46,213 |
| Interquartile Range (IQR) | $12,397 | $12,463 |
| Standard Deviation (Sample) | $12,507 | $10,783 |
| Standard Deviation (Population) | $12,433 | $10,682 |
Demographics Similar to Bolivians and Immigrants from Indonesia by Median Female Earnings
In terms of median female earnings, the demographic groups most similar to Bolivians are Immigrants from Bolivia ($43,467, a difference of 0.050%), Immigrants from Serbia ($43,385, a difference of 0.14%), Immigrants from Europe ($43,523, a difference of 0.18%), Immigrants from Uzbekistan ($43,363, a difference of 0.19%), and Maltese ($43,357, a difference of 0.20%). Similarly, the demographic groups most similar to Immigrants from Indonesia are Immigrants from Serbia ($43,385, a difference of 0.060%), Immigrants from Uzbekistan ($43,363, a difference of 0.11%), Immigrants from Bolivia ($43,467, a difference of 0.13%), Maltese ($43,357, a difference of 0.13%), and Immigrants from Lithuania ($43,317, a difference of 0.22%).
| Demographics | Rating | Rank | Median Female Earnings |
| Immigrants | Switzerland | 100.0 /100 | #37 | Exceptional $43,996 |
| Latvians | 100.0 /100 | #38 | Exceptional $43,941 |
| Israelis | 100.0 /100 | #39 | Exceptional $43,852 |
| Immigrants | Malaysia | 100.0 /100 | #40 | Exceptional $43,835 |
| Bhutanese | 100.0 /100 | #41 | Exceptional $43,648 |
| Immigrants | Denmark | 100.0 /100 | #42 | Exceptional $43,646 |
| Bulgarians | 100.0 /100 | #43 | Exceptional $43,638 |
| Immigrants | Czechoslovakia | 100.0 /100 | #44 | Exceptional $43,571 |
| Immigrants | Europe | 100.0 /100 | #45 | Exceptional $43,523 |
| Immigrants | Bolivia | 100.0 /100 | #46 | Exceptional $43,467 |
| Bolivians | 100.0 /100 | #47 | Exceptional $43,445 |
| Immigrants | Indonesia | 100.0 /100 | #48 | Exceptional $43,412 |
| Immigrants | Serbia | 100.0 /100 | #49 | Exceptional $43,385 |
| Immigrants | Uzbekistan | 100.0 /100 | #50 | Exceptional $43,363 |
| Maltese | 100.0 /100 | #51 | Exceptional $43,357 |
| Immigrants | Lithuania | 99.9 /100 | #52 | Exceptional $43,317 |
| Immigrants | Eastern Europe | 99.9 /100 | #53 | Exceptional $43,309 |
| Australians | 99.9 /100 | #54 | Exceptional $43,308 |
| Egyptians | 99.9 /100 | #55 | Exceptional $43,305 |
| Immigrants | Croatia | 99.9 /100 | #56 | Exceptional $43,258 |
| Ethiopians | 99.9 /100 | #57 | Exceptional $43,243 |