Colombian vs Immigrants from Indonesia Currently Married
COMPARE
Colombian
Immigrants from Indonesia
Currently Married
Currently Married Comparison
Colombians
Immigrants from Indonesia
46.3%
CURRENTLY MARRIED
31.8/ 100
METRIC RATING
188th/ 347
METRIC RANK
47.6%
CURRENTLY MARRIED
90.5/ 100
METRIC RATING
115th/ 347
METRIC RANK
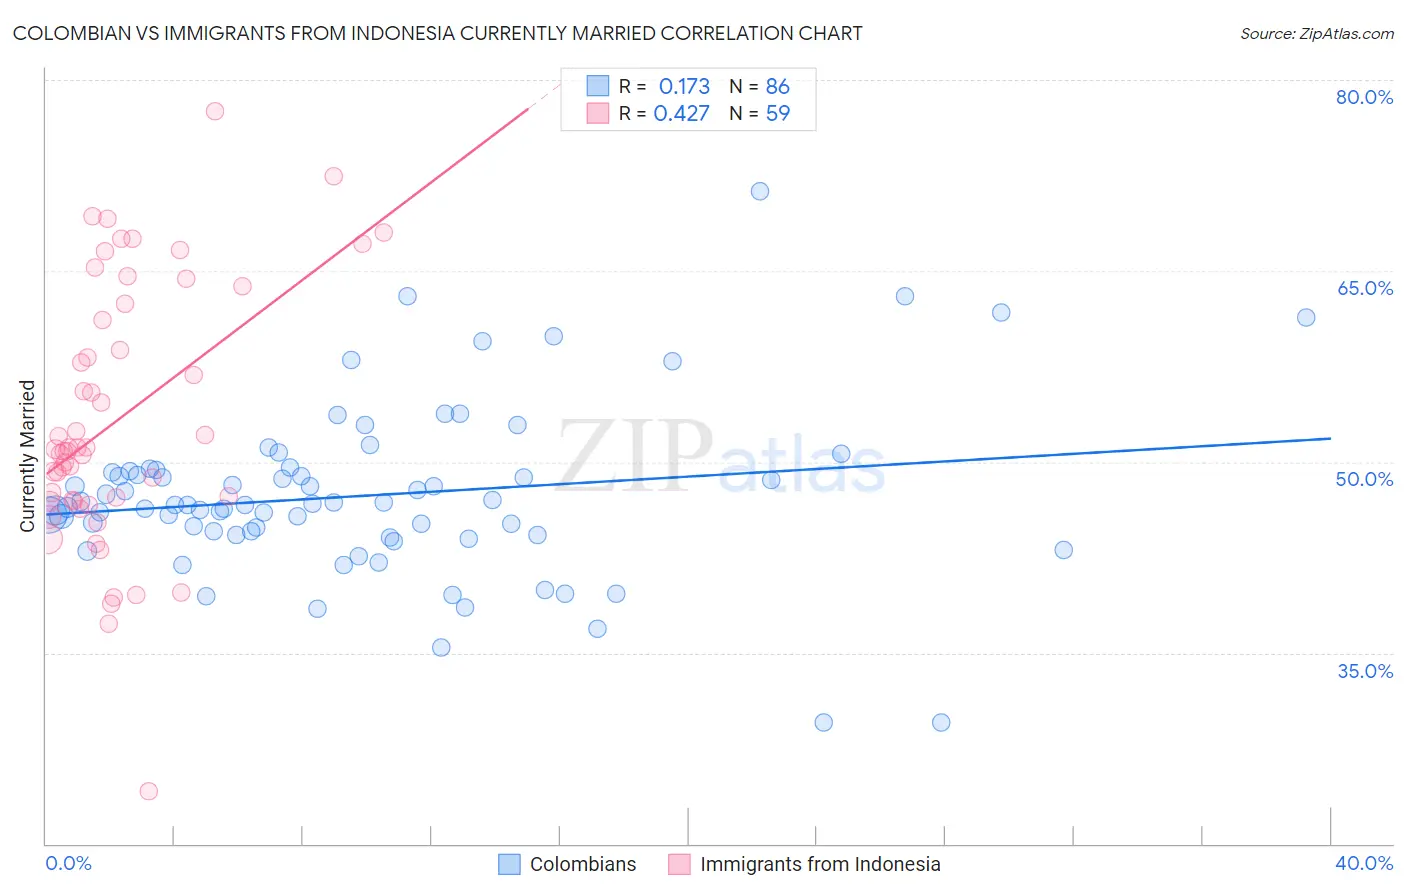
Colombian vs Immigrants from Indonesia Currently Married Correlation Chart
The statistical analysis conducted on geographies consisting of 419,624,806 people shows a poor positive correlation between the proportion of Colombians and percentage of population currently married in the United States with a correlation coefficient (R) of 0.173 and weighted average of 46.3%. Similarly, the statistical analysis conducted on geographies consisting of 215,768,024 people shows a moderate positive correlation between the proportion of Immigrants from Indonesia and percentage of population currently married in the United States with a correlation coefficient (R) of 0.427 and weighted average of 47.6%, a difference of 2.8%.
Currently Married Correlation Summary
| Measurement | Colombian | Immigrants from Indonesia |
| Minimum | 29.5% | 24.1% |
| Maximum | 71.3% | 77.5% |
| Range | 41.8% | 53.4% |
| Mean | 47.4% | 53.3% |
| Median | 46.6% | 51.0% |
| Interquartile 25% (IQ1) | 44.3% | 46.9% |
| Interquartile 75% (IQ3) | 49.3% | 62.4% |
| Interquartile Range (IQR) | 5.0% | 15.5% |
| Standard Deviation (Sample) | 6.8% | 10.3% |
| Standard Deviation (Population) | 6.7% | 10.2% |
Similar Demographics by Currently Married
Demographics Similar to Colombians by Currently Married
In terms of currently married, the demographic groups most similar to Colombians are Fijian (46.3%, a difference of 0.060%), Choctaw (46.3%, a difference of 0.12%), Immigrants from Peru (46.4%, a difference of 0.14%), Immigrants from France (46.2%, a difference of 0.18%), and Immigrants from Chile (46.4%, a difference of 0.20%).
| Demographics | Rating | Rank | Currently Married |
| Ottawa | 43.0 /100 | #181 | Average 46.5% |
| Potawatomi | 41.9 /100 | #182 | Average 46.5% |
| Immigrants | Northern Africa | 39.7 /100 | #183 | Fair 46.5% |
| Brazilians | 39.3 /100 | #184 | Fair 46.4% |
| Mongolians | 37.6 /100 | #185 | Fair 46.4% |
| Immigrants | Chile | 36.8 /100 | #186 | Fair 46.4% |
| Immigrants | Peru | 35.3 /100 | #187 | Fair 46.4% |
| Colombians | 31.8 /100 | #188 | Fair 46.3% |
| Fijians | 30.3 /100 | #189 | Fair 46.3% |
| Choctaw | 29.1 /100 | #190 | Fair 46.3% |
| Immigrants | France | 27.7 /100 | #191 | Fair 46.2% |
| Soviet Union | 25.7 /100 | #192 | Fair 46.2% |
| Immigrants | Fiji | 25.0 /100 | #193 | Fair 46.2% |
| South Americans | 23.8 /100 | #194 | Fair 46.1% |
| Immigrants | Nepal | 23.7 /100 | #195 | Fair 46.1% |
Demographics Similar to Immigrants from Indonesia by Currently Married
In terms of currently married, the demographic groups most similar to Immigrants from Indonesia are South African (47.6%, a difference of 0.0%), Palestinian (47.6%, a difference of 0.010%), Puget Sound Salish (47.6%, a difference of 0.020%), Immigrants from Philippines (47.6%, a difference of 0.030%), and Australian (47.6%, a difference of 0.030%).
| Demographics | Rating | Rank | Currently Married |
| Tsimshian | 92.4 /100 | #108 | Exceptional 47.7% |
| Immigrants | Egypt | 92.3 /100 | #109 | Exceptional 47.7% |
| Immigrants | Russia | 92.0 /100 | #110 | Exceptional 47.7% |
| Immigrants | Hungary | 91.2 /100 | #111 | Exceptional 47.6% |
| Immigrants | Western Europe | 91.1 /100 | #112 | Exceptional 47.6% |
| Immigrants | Denmark | 90.9 /100 | #113 | Exceptional 47.6% |
| South Africans | 90.5 /100 | #114 | Exceptional 47.6% |
| Immigrants | Indonesia | 90.5 /100 | #115 | Exceptional 47.6% |
| Palestinians | 90.4 /100 | #116 | Exceptional 47.6% |
| Puget Sound Salish | 90.3 /100 | #117 | Exceptional 47.6% |
| Immigrants | Philippines | 90.2 /100 | #118 | Exceptional 47.6% |
| Australians | 90.2 /100 | #119 | Exceptional 47.6% |
| Syrians | 88.9 /100 | #120 | Excellent 47.5% |
| Immigrants | Croatia | 88.6 /100 | #121 | Excellent 47.5% |
| Osage | 87.9 /100 | #122 | Excellent 47.5% |