Salvadoran vs Ukrainian Married-couple Households
COMPARE
Salvadoran
Ukrainian
Married-couple Households
Married-couple Households Comparison
Salvadorans
Ukrainians
44.7%
MARRIED-COUPLE HOUSEHOLDS
1.9/ 100
METRIC RATING
227th/ 347
METRIC RANK
48.1%
MARRIED-COUPLE HOUSEHOLDS
97.6/ 100
METRIC RATING
84th/ 347
METRIC RANK
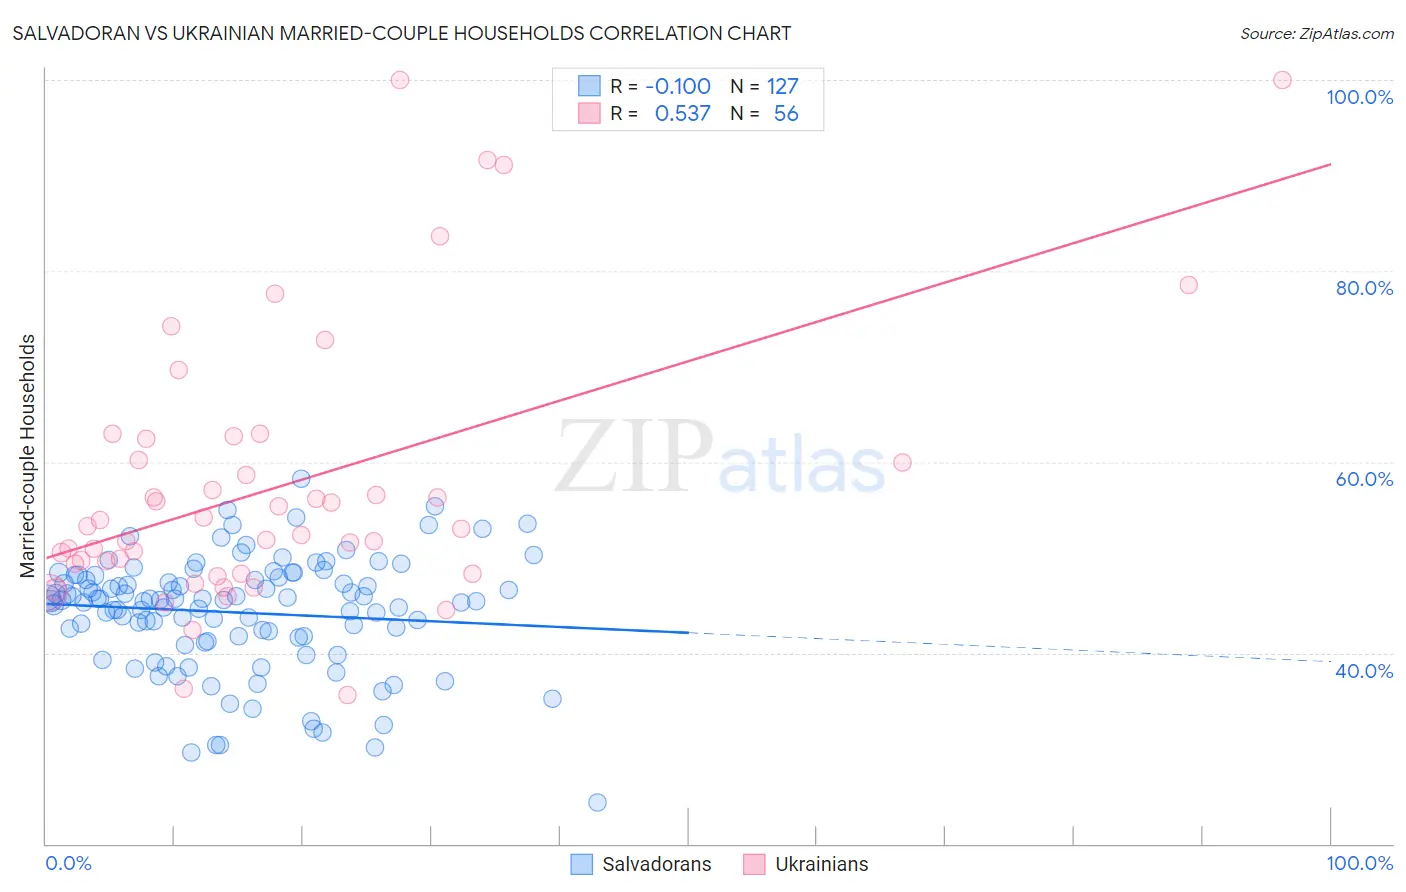
Salvadoran vs Ukrainian Married-couple Households Correlation Chart
The statistical analysis conducted on geographies consisting of 398,667,012 people shows a poor negative correlation between the proportion of Salvadorans and percentage of married-couple family households in the United States with a correlation coefficient (R) of -0.100 and weighted average of 44.7%. Similarly, the statistical analysis conducted on geographies consisting of 448,301,259 people shows a substantial positive correlation between the proportion of Ukrainians and percentage of married-couple family households in the United States with a correlation coefficient (R) of 0.537 and weighted average of 48.1%, a difference of 7.4%.
Married-couple Households Correlation Summary
| Measurement | Salvadoran | Ukrainian |
| Minimum | 24.4% | 35.6% |
| Maximum | 58.2% | 100.0% |
| Range | 33.9% | 64.4% |
| Mean | 44.2% | 57.5% |
| Median | 45.5% | 53.1% |
| Interquartile 25% (IQ1) | 41.6% | 48.8% |
| Interquartile 75% (IQ3) | 47.9% | 61.3% |
| Interquartile Range (IQR) | 6.3% | 12.5% |
| Standard Deviation (Sample) | 6.0% | 14.4% |
| Standard Deviation (Population) | 5.9% | 14.2% |
Similar Demographics by Married-couple Households
Demographics Similar to Salvadorans by Married-couple Households
In terms of married-couple households, the demographic groups most similar to Salvadorans are Kenyan (44.7%, a difference of 0.13%), Immigrants from Latin America (44.7%, a difference of 0.18%), Alsatian (44.8%, a difference of 0.19%), Soviet Union (44.6%, a difference of 0.22%), and Houma (44.6%, a difference of 0.22%).
| Demographics | Rating | Rank | Married-couple Households |
| Immigrants | Thailand | 5.1 /100 | #220 | Tragic 45.2% |
| Tlingit-Haida | 4.9 /100 | #221 | Tragic 45.1% |
| Immigrants | Laos | 4.6 /100 | #222 | Tragic 45.1% |
| Immigrants | Cambodia | 2.7 /100 | #223 | Tragic 44.9% |
| Immigrants | Micronesia | 2.6 /100 | #224 | Tragic 44.9% |
| Dutch West Indians | 2.6 /100 | #225 | Tragic 44.9% |
| Alsatians | 2.3 /100 | #226 | Tragic 44.8% |
| Salvadorans | 1.9 /100 | #227 | Tragic 44.7% |
| Kenyans | 1.7 /100 | #228 | Tragic 44.7% |
| Immigrants | Latin America | 1.6 /100 | #229 | Tragic 44.7% |
| Soviet Union | 1.6 /100 | #230 | Tragic 44.6% |
| Houma | 1.5 /100 | #231 | Tragic 44.6% |
| Marshallese | 1.5 /100 | #232 | Tragic 44.6% |
| Immigrants | Uganda | 1.5 /100 | #233 | Tragic 44.6% |
| Immigrants | Panama | 1.3 /100 | #234 | Tragic 44.6% |
Demographics Similar to Ukrainians by Married-couple Households
In terms of married-couple households, the demographic groups most similar to Ukrainians are Guamanian/Chamorro (48.1%, a difference of 0.020%), Immigrants from Poland (48.1%, a difference of 0.040%), Immigrants from Israel (48.0%, a difference of 0.050%), Belgian (48.0%, a difference of 0.070%), and Immigrants from Ireland (48.0%, a difference of 0.080%).
| Demographics | Rating | Rank | Married-couple Households |
| Canadians | 98.2 /100 | #77 | Exceptional 48.2% |
| Egyptians | 98.2 /100 | #78 | Exceptional 48.2% |
| Immigrants | Netherlands | 98.2 /100 | #79 | Exceptional 48.2% |
| Russians | 98.1 /100 | #80 | Exceptional 48.2% |
| Finns | 98.0 /100 | #81 | Exceptional 48.1% |
| Immigrants | Poland | 97.7 /100 | #82 | Exceptional 48.1% |
| Guamanians/Chamorros | 97.6 /100 | #83 | Exceptional 48.1% |
| Ukrainians | 97.6 /100 | #84 | Exceptional 48.1% |
| Immigrants | Israel | 97.4 /100 | #85 | Exceptional 48.0% |
| Belgians | 97.4 /100 | #86 | Exceptional 48.0% |
| Immigrants | Ireland | 97.3 /100 | #87 | Exceptional 48.0% |
| Afghans | 97.3 /100 | #88 | Exceptional 48.0% |
| Cypriots | 97.2 /100 | #89 | Exceptional 48.0% |
| French | 97.2 /100 | #90 | Exceptional 48.0% |
| Immigrants | Moldova | 97.0 /100 | #91 | Exceptional 48.0% |