Black/African American vs Subsaharan African Single Mother Households
COMPARE
Black/African American
Subsaharan African
Single Mother Households
Single Mother Households Comparison
Blacks/African Americans
Sub-Saharan Africans
9.0%
SINGLE MOTHER HOUSEHOLDS
0.0/ 100
METRIC RATING
339th/ 347
METRIC RANK
7.8%
SINGLE MOTHER HOUSEHOLDS
0.0/ 100
METRIC RATING
289th/ 347
METRIC RANK
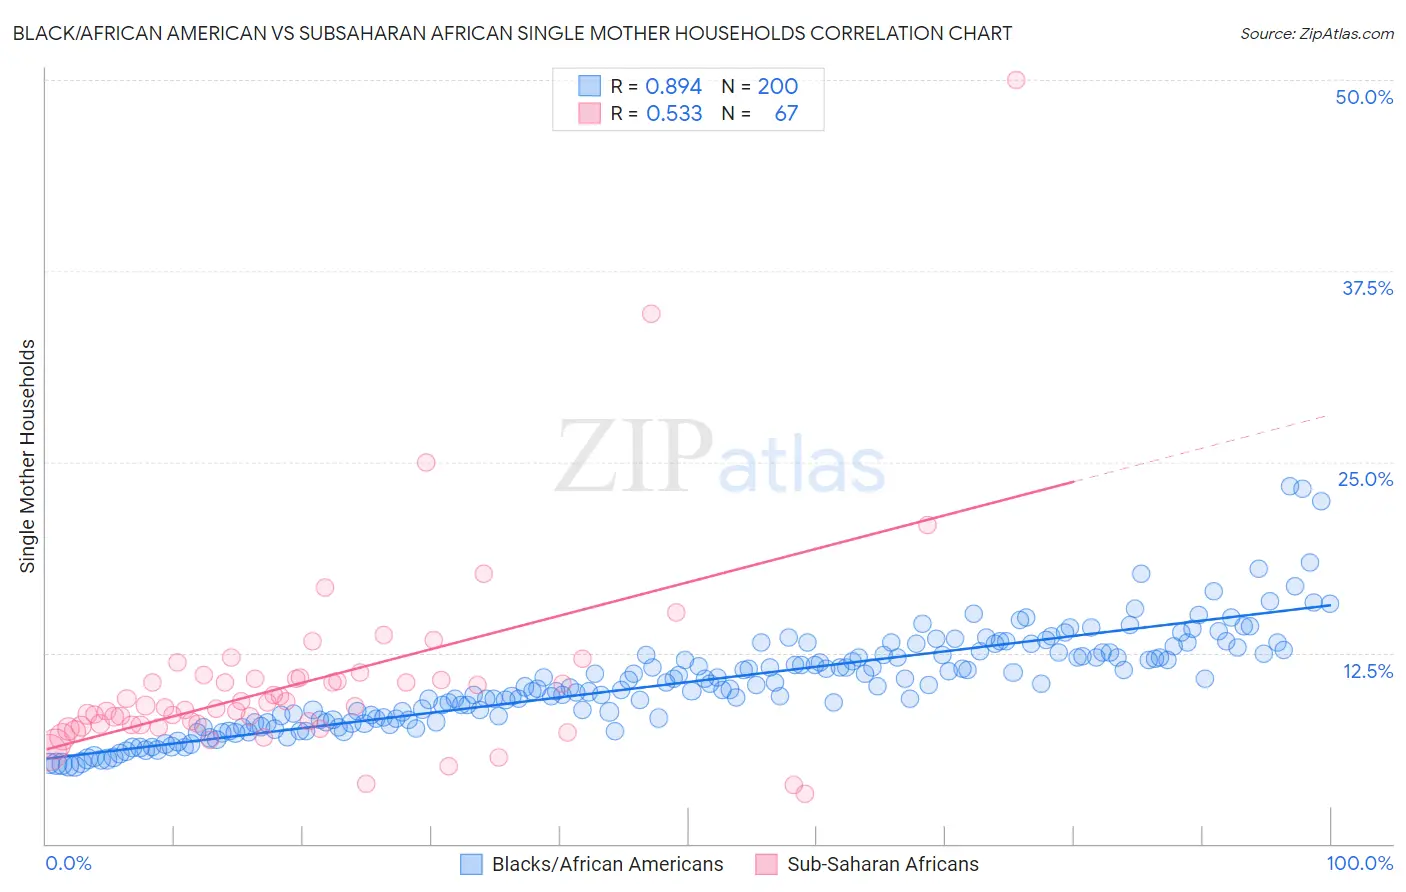
Black/African American vs Subsaharan African Single Mother Households Correlation Chart
The statistical analysis conducted on geographies consisting of 561,713,889 people shows a very strong positive correlation between the proportion of Blacks/African Americans and percentage of single mother households in the United States with a correlation coefficient (R) of 0.894 and weighted average of 9.0%. Similarly, the statistical analysis conducted on geographies consisting of 505,994,563 people shows a substantial positive correlation between the proportion of Sub-Saharan Africans and percentage of single mother households in the United States with a correlation coefficient (R) of 0.533 and weighted average of 7.8%, a difference of 15.2%.
Single Mother Households Correlation Summary
| Measurement | Black/African American | Subsaharan African |
| Minimum | 5.1% | 3.2% |
| Maximum | 23.4% | 50.0% |
| Range | 18.3% | 46.8% |
| Mean | 10.6% | 10.6% |
| Median | 10.4% | 9.0% |
| Interquartile 25% (IQ1) | 8.1% | 7.8% |
| Interquartile 75% (IQ3) | 12.5% | 10.8% |
| Interquartile Range (IQR) | 4.4% | 3.0% |
| Standard Deviation (Sample) | 3.3% | 6.8% |
| Standard Deviation (Population) | 3.2% | 6.7% |
Similar Demographics by Single Mother Households
Demographics Similar to Blacks/African Americans by Single Mother Households
In terms of single mother households, the demographic groups most similar to Blacks/African Americans are Lumbee (9.1%, a difference of 1.2%), Cape Verdean (8.9%, a difference of 1.5%), Tohono O'odham (9.1%, a difference of 1.6%), Navajo (8.8%, a difference of 1.7%), and Menominee (9.2%, a difference of 1.9%).
| Demographics | Rating | Rank | Single Mother Households |
| U.S. Virgin Islanders | 0.0 /100 | #332 | Tragic 8.6% |
| Liberians | 0.0 /100 | #333 | Tragic 8.6% |
| Immigrants | Liberia | 0.0 /100 | #334 | Tragic 8.7% |
| Immigrants | Dominica | 0.0 /100 | #335 | Tragic 8.7% |
| Puerto Ricans | 0.0 /100 | #336 | Tragic 8.7% |
| Navajo | 0.0 /100 | #337 | Tragic 8.8% |
| Cape Verdeans | 0.0 /100 | #338 | Tragic 8.9% |
| Blacks/African Americans | 0.0 /100 | #339 | Tragic 9.0% |
| Lumbee | 0.0 /100 | #340 | Tragic 9.1% |
| Tohono O'odham | 0.0 /100 | #341 | Tragic 9.1% |
| Menominee | 0.0 /100 | #342 | Tragic 9.2% |
| Dominicans | 0.0 /100 | #343 | Tragic 9.2% |
| Immigrants | Dominican Republic | 0.0 /100 | #344 | Tragic 9.5% |
| Immigrants | Cabo Verde | 0.0 /100 | #345 | Tragic 9.6% |
| Yuman | 0.0 /100 | #346 | Tragic 9.6% |
Demographics Similar to Sub-Saharan Africans by Single Mother Households
In terms of single mother households, the demographic groups most similar to Sub-Saharan Africans are Immigrants from Nigeria (7.8%, a difference of 0.42%), West Indian (7.8%, a difference of 0.50%), Ghanaian (7.8%, a difference of 0.51%), Immigrants from Cameroon (7.9%, a difference of 0.87%), and Sierra Leonean (7.7%, a difference of 0.92%).
| Demographics | Rating | Rank | Single Mother Households |
| Guatemalans | 0.0 /100 | #282 | Tragic 7.7% |
| Nigerians | 0.0 /100 | #283 | Tragic 7.7% |
| Immigrants | Belize | 0.0 /100 | #284 | Tragic 7.7% |
| Trinidadians and Tobagonians | 0.0 /100 | #285 | Tragic 7.7% |
| Immigrants | Middle Africa | 0.0 /100 | #286 | Tragic 7.7% |
| Immigrants | Guatemala | 0.0 /100 | #287 | Tragic 7.7% |
| Sierra Leoneans | 0.0 /100 | #288 | Tragic 7.7% |
| Sub-Saharan Africans | 0.0 /100 | #289 | Tragic 7.8% |
| Immigrants | Nigeria | 0.0 /100 | #290 | Tragic 7.8% |
| West Indians | 0.0 /100 | #291 | Tragic 7.8% |
| Ghanaians | 0.0 /100 | #292 | Tragic 7.8% |
| Immigrants | Cameroon | 0.0 /100 | #293 | Tragic 7.9% |
| Apache | 0.0 /100 | #294 | Tragic 7.9% |
| Barbadians | 0.0 /100 | #295 | Tragic 7.9% |
| Immigrants | Latin America | 0.0 /100 | #296 | Tragic 7.9% |