Black/African American vs Immigrants from Grenada Single Mother Households
COMPARE
Black/African American
Immigrants from Grenada
Single Mother Households
Single Mother Households Comparison
Blacks/African Americans
Immigrants from Grenada
9.0%
SINGLE MOTHER HOUSEHOLDS
0.0/ 100
METRIC RATING
339th/ 347
METRIC RANK
8.2%
SINGLE MOTHER HOUSEHOLDS
0.0/ 100
METRIC RATING
313th/ 347
METRIC RANK
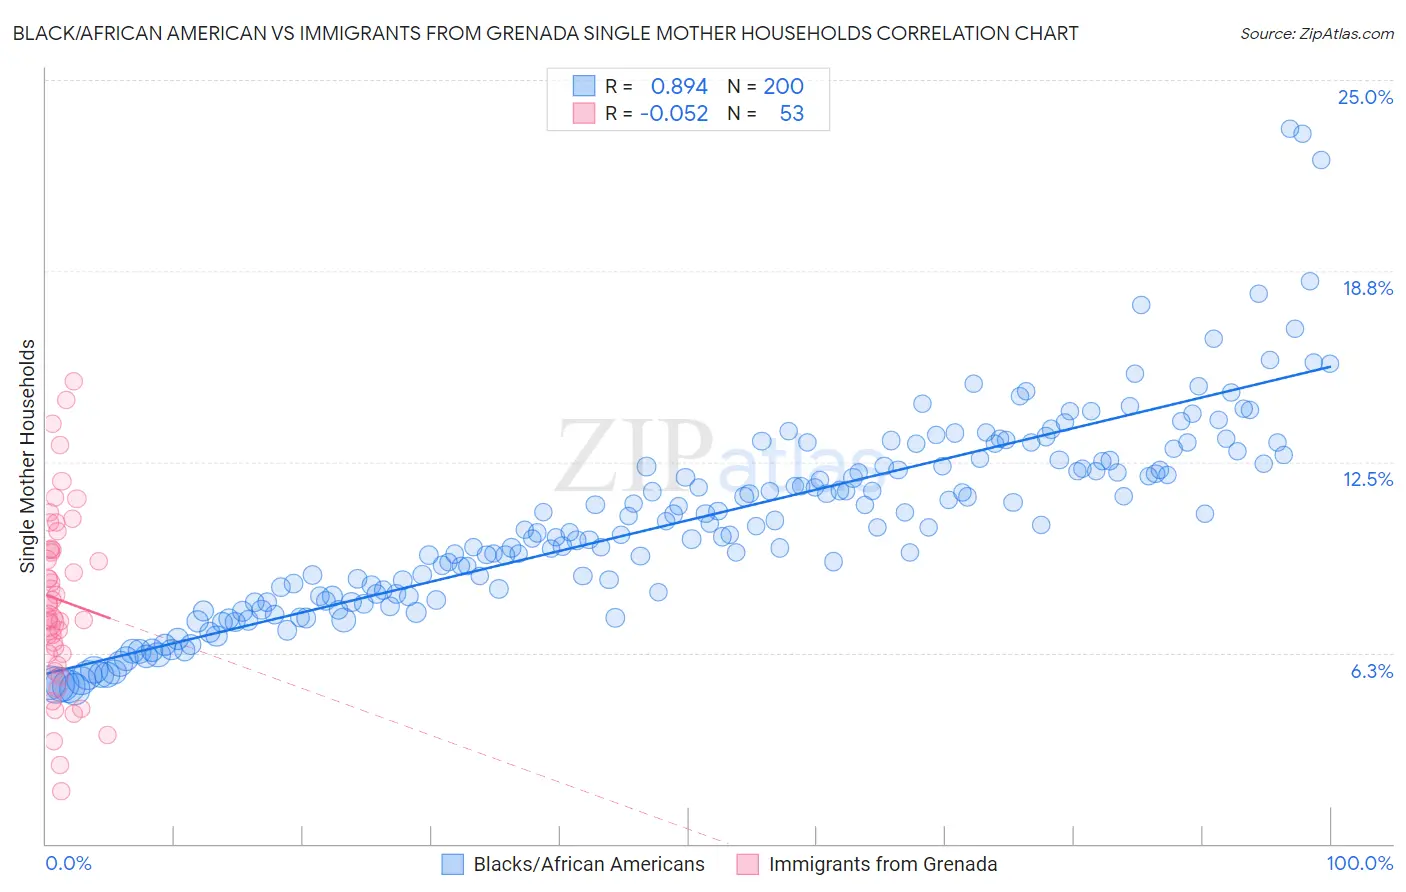
Black/African American vs Immigrants from Grenada Single Mother Households Correlation Chart
The statistical analysis conducted on geographies consisting of 561,713,889 people shows a very strong positive correlation between the proportion of Blacks/African Americans and percentage of single mother households in the United States with a correlation coefficient (R) of 0.894 and weighted average of 9.0%. Similarly, the statistical analysis conducted on geographies consisting of 67,162,993 people shows a slight negative correlation between the proportion of Immigrants from Grenada and percentage of single mother households in the United States with a correlation coefficient (R) of -0.052 and weighted average of 8.2%, a difference of 10.3%.
Single Mother Households Correlation Summary
| Measurement | Black/African American | Immigrants from Grenada |
| Minimum | 5.1% | 1.7% |
| Maximum | 23.4% | 15.1% |
| Range | 18.3% | 13.4% |
| Mean | 10.6% | 8.0% |
| Median | 10.4% | 7.8% |
| Interquartile 25% (IQ1) | 8.1% | 6.2% |
| Interquartile 75% (IQ3) | 12.5% | 9.6% |
| Interquartile Range (IQR) | 4.4% | 3.4% |
| Standard Deviation (Sample) | 3.3% | 2.9% |
| Standard Deviation (Population) | 3.2% | 2.9% |
Similar Demographics by Single Mother Households
Demographics Similar to Blacks/African Americans by Single Mother Households
In terms of single mother households, the demographic groups most similar to Blacks/African Americans are Lumbee (9.1%, a difference of 1.2%), Cape Verdean (8.9%, a difference of 1.5%), Tohono O'odham (9.1%, a difference of 1.6%), Navajo (8.8%, a difference of 1.7%), and Menominee (9.2%, a difference of 1.9%).
| Demographics | Rating | Rank | Single Mother Households |
| U.S. Virgin Islanders | 0.0 /100 | #332 | Tragic 8.6% |
| Liberians | 0.0 /100 | #333 | Tragic 8.6% |
| Immigrants | Liberia | 0.0 /100 | #334 | Tragic 8.7% |
| Immigrants | Dominica | 0.0 /100 | #335 | Tragic 8.7% |
| Puerto Ricans | 0.0 /100 | #336 | Tragic 8.7% |
| Navajo | 0.0 /100 | #337 | Tragic 8.8% |
| Cape Verdeans | 0.0 /100 | #338 | Tragic 8.9% |
| Blacks/African Americans | 0.0 /100 | #339 | Tragic 9.0% |
| Lumbee | 0.0 /100 | #340 | Tragic 9.1% |
| Tohono O'odham | 0.0 /100 | #341 | Tragic 9.1% |
| Menominee | 0.0 /100 | #342 | Tragic 9.2% |
| Dominicans | 0.0 /100 | #343 | Tragic 9.2% |
| Immigrants | Dominican Republic | 0.0 /100 | #344 | Tragic 9.5% |
| Immigrants | Cabo Verde | 0.0 /100 | #345 | Tragic 9.6% |
| Yuman | 0.0 /100 | #346 | Tragic 9.6% |
Demographics Similar to Immigrants from Grenada by Single Mother Households
In terms of single mother households, the demographic groups most similar to Immigrants from Grenada are Immigrants from Mexico (8.2%, a difference of 0.12%), Immigrants from Western Africa (8.2%, a difference of 0.15%), Bangladeshi (8.1%, a difference of 0.16%), African (8.2%, a difference of 0.29%), and Immigrants from Honduras (8.2%, a difference of 0.43%).
| Demographics | Rating | Rank | Single Mother Households |
| Immigrants | Barbados | 0.0 /100 | #306 | Tragic 8.0% |
| Immigrants | St. Vincent and the Grenadines | 0.0 /100 | #307 | Tragic 8.0% |
| Immigrants | Central America | 0.0 /100 | #308 | Tragic 8.1% |
| Cheyenne | 0.0 /100 | #309 | Tragic 8.1% |
| Hondurans | 0.0 /100 | #310 | Tragic 8.1% |
| Immigrants | Congo | 0.0 /100 | #311 | Tragic 8.1% |
| Bangladeshis | 0.0 /100 | #312 | Tragic 8.1% |
| Immigrants | Grenada | 0.0 /100 | #313 | Tragic 8.2% |
| Immigrants | Mexico | 0.0 /100 | #314 | Tragic 8.2% |
| Immigrants | Western Africa | 0.0 /100 | #315 | Tragic 8.2% |
| Africans | 0.0 /100 | #316 | Tragic 8.2% |
| Immigrants | Honduras | 0.0 /100 | #317 | Tragic 8.2% |
| Senegalese | 0.0 /100 | #318 | Tragic 8.2% |
| Jamaicans | 0.0 /100 | #319 | Tragic 8.2% |
| Bahamians | 0.0 /100 | #320 | Tragic 8.3% |