Black/African American vs Immigrants from Hong Kong 6th Grade
COMPARE
Black/African American
Immigrants from Hong Kong
6th Grade
6th Grade Comparison
Blacks/African Americans
Immigrants from Hong Kong
97.0%
6TH GRADE
30.2/ 100
METRIC RATING
189th/ 347
METRIC RANK
96.3%
6TH GRADE
0.2/ 100
METRIC RATING
271st/ 347
METRIC RANK
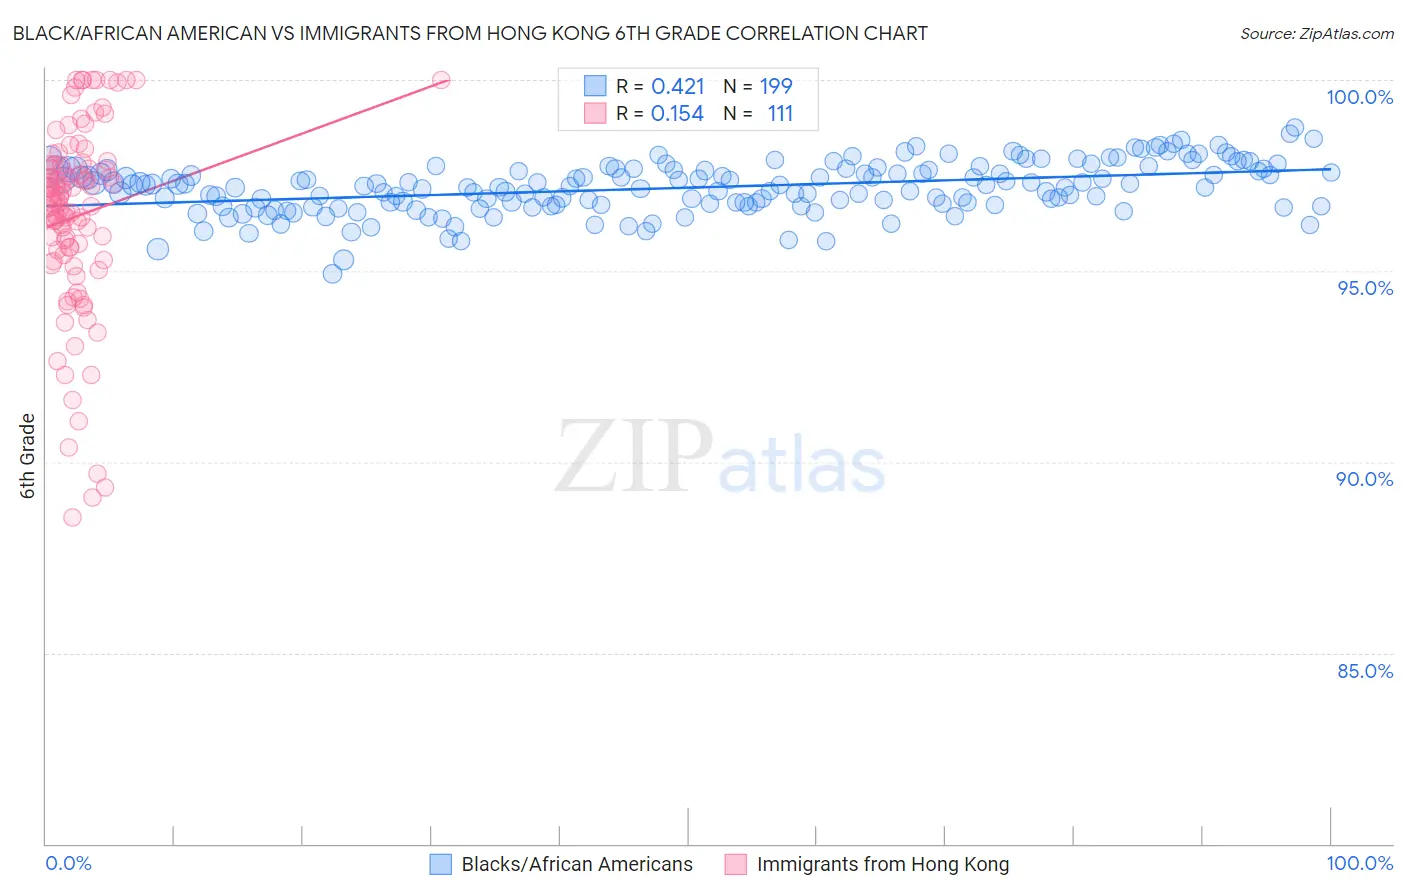
Black/African American vs Immigrants from Hong Kong 6th Grade Correlation Chart
The statistical analysis conducted on geographies consisting of 566,043,668 people shows a moderate positive correlation between the proportion of Blacks/African Americans and percentage of population with at least 6th grade education in the United States with a correlation coefficient (R) of 0.421 and weighted average of 97.0%. Similarly, the statistical analysis conducted on geographies consisting of 253,909,193 people shows a poor positive correlation between the proportion of Immigrants from Hong Kong and percentage of population with at least 6th grade education in the United States with a correlation coefficient (R) of 0.154 and weighted average of 96.3%, a difference of 0.65%.
6th Grade Correlation Summary
| Measurement | Black/African American | Immigrants from Hong Kong |
| Minimum | 94.9% | 88.6% |
| Maximum | 98.7% | 100.0% |
| Range | 3.8% | 11.4% |
| Mean | 97.2% | 96.4% |
| Median | 97.2% | 96.9% |
| Interquartile 25% (IQ1) | 96.7% | 95.4% |
| Interquartile 75% (IQ3) | 97.7% | 97.8% |
| Interquartile Range (IQR) | 0.92% | 2.4% |
| Standard Deviation (Sample) | 0.66% | 2.5% |
| Standard Deviation (Population) | 0.66% | 2.5% |
Similar Demographics by 6th Grade
Demographics Similar to Blacks/African Americans by 6th Grade
In terms of 6th grade, the demographic groups most similar to Blacks/African Americans are Guamanian/Chamorro (97.0%, a difference of 0.0%), Immigrants from Argentina (97.0%, a difference of 0.0%), Argentinean (97.0%, a difference of 0.010%), Immigrants from Egypt (97.0%, a difference of 0.010%), and Dutch West Indian (96.9%, a difference of 0.010%).
| Demographics | Rating | Rank | 6th Grade |
| Immigrants | Ukraine | 35.6 /100 | #182 | Fair 97.0% |
| Immigrants | Venezuela | 34.5 /100 | #183 | Fair 97.0% |
| Spanish Americans | 33.5 /100 | #184 | Fair 97.0% |
| Argentineans | 33.0 /100 | #185 | Fair 97.0% |
| Immigrants | Egypt | 31.4 /100 | #186 | Fair 97.0% |
| Guamanians/Chamorros | 30.6 /100 | #187 | Fair 97.0% |
| Immigrants | Argentina | 30.4 /100 | #188 | Fair 97.0% |
| Blacks/African Americans | 30.2 /100 | #189 | Fair 97.0% |
| Dutch West Indians | 28.3 /100 | #190 | Fair 96.9% |
| Panamanians | 27.3 /100 | #191 | Fair 96.9% |
| Hawaiians | 27.0 /100 | #192 | Fair 96.9% |
| Paraguayans | 26.6 /100 | #193 | Fair 96.9% |
| Immigrants | Lebanon | 25.6 /100 | #194 | Fair 96.9% |
| Immigrants | Brazil | 25.5 /100 | #195 | Fair 96.9% |
| Immigrants | Uganda | 21.2 /100 | #196 | Fair 96.9% |
Demographics Similar to Immigrants from Hong Kong by 6th Grade
In terms of 6th grade, the demographic groups most similar to Immigrants from Hong Kong are Immigrants from Uzbekistan (96.3%, a difference of 0.010%), West Indian (96.3%, a difference of 0.010%), Immigrants from South America (96.3%, a difference of 0.010%), Immigrants from Bolivia (96.3%, a difference of 0.030%), and Ghanaian (96.4%, a difference of 0.040%).
| Demographics | Rating | Rank | 6th Grade |
| Armenians | 0.3 /100 | #264 | Tragic 96.4% |
| Immigrants | Jamaica | 0.2 /100 | #265 | Tragic 96.4% |
| Ghanaians | 0.2 /100 | #266 | Tragic 96.4% |
| Afghans | 0.2 /100 | #267 | Tragic 96.4% |
| Immigrants | Uzbekistan | 0.2 /100 | #268 | Tragic 96.3% |
| West Indians | 0.2 /100 | #269 | Tragic 96.3% |
| Immigrants | South America | 0.2 /100 | #270 | Tragic 96.3% |
| Immigrants | Hong Kong | 0.2 /100 | #271 | Tragic 96.3% |
| Immigrants | Bolivia | 0.1 /100 | #272 | Tragic 96.3% |
| Immigrants | Cameroon | 0.1 /100 | #273 | Tragic 96.3% |
| Immigrants | Philippines | 0.1 /100 | #274 | Tragic 96.3% |
| Immigrants | Ghana | 0.1 /100 | #275 | Tragic 96.3% |
| Yaqui | 0.1 /100 | #276 | Tragic 96.3% |
| Immigrants | Western Africa | 0.1 /100 | #277 | Tragic 96.3% |
| Immigrants | Thailand | 0.1 /100 | #278 | Tragic 96.3% |