Senegalese vs Immigrants from Europe Currently Married
COMPARE
Senegalese
Immigrants from Europe
Currently Married
Currently Married Comparison
Senegalese
Immigrants from Europe
40.6%
CURRENTLY MARRIED
0.0/ 100
METRIC RATING
327th/ 347
METRIC RANK
48.1%
CURRENTLY MARRIED
96.9/ 100
METRIC RATING
82nd/ 347
METRIC RANK
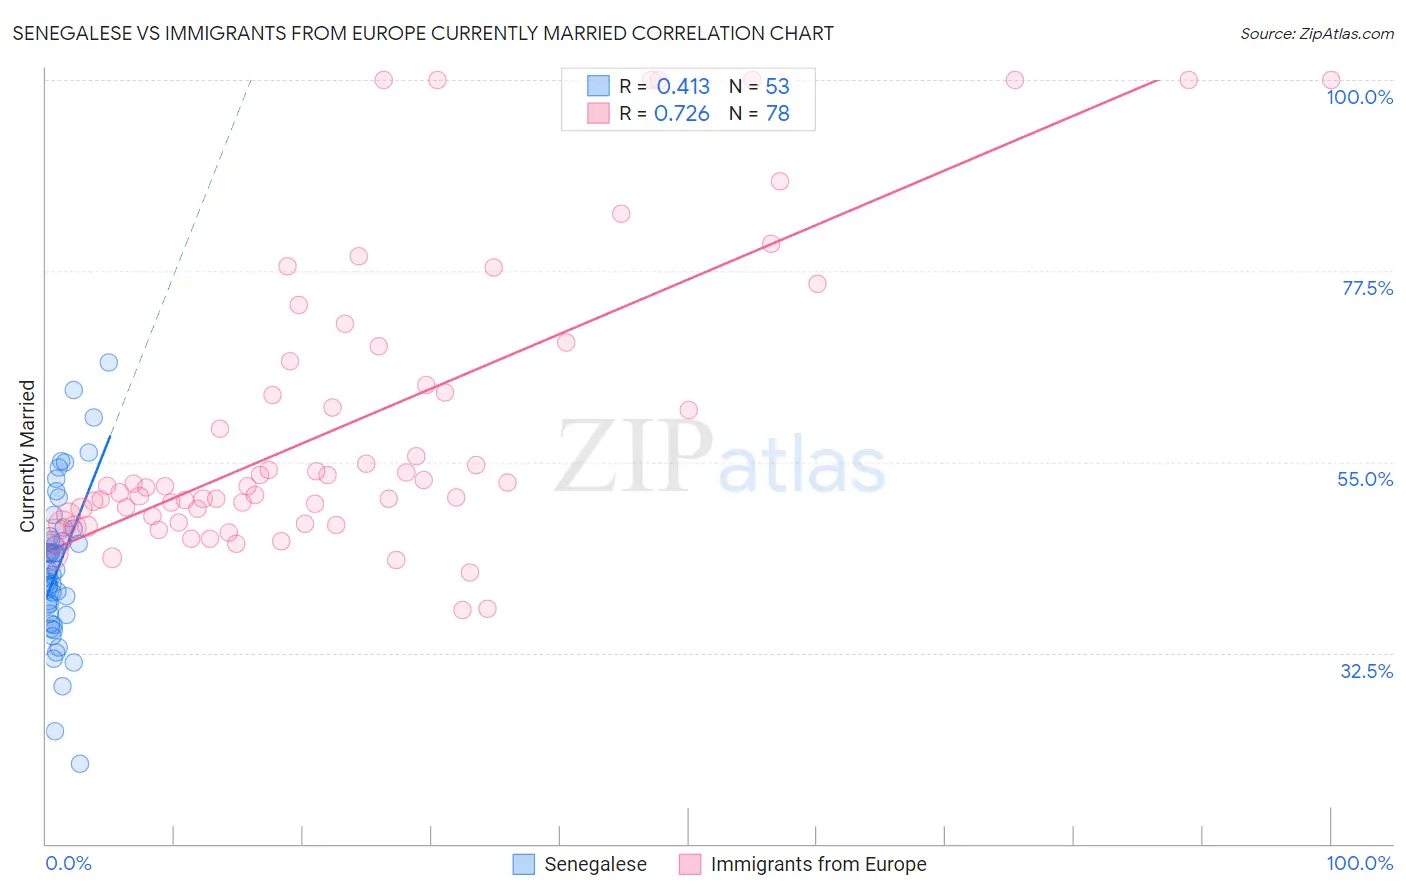
Senegalese vs Immigrants from Europe Currently Married Correlation Chart
The statistical analysis conducted on geographies consisting of 78,135,474 people shows a moderate positive correlation between the proportion of Senegalese and percentage of population currently married in the United States with a correlation coefficient (R) of 0.413 and weighted average of 40.6%. Similarly, the statistical analysis conducted on geographies consisting of 547,318,007 people shows a strong positive correlation between the proportion of Immigrants from Europe and percentage of population currently married in the United States with a correlation coefficient (R) of 0.726 and weighted average of 48.1%, a difference of 18.6%.
Currently Married Correlation Summary
| Measurement | Senegalese | Immigrants from Europe |
| Minimum | 19.4% | 37.5% |
| Maximum | 66.7% | 100.0% |
| Range | 47.3% | 62.5% |
| Mean | 42.6% | 59.6% |
| Median | 42.1% | 52.1% |
| Interquartile 25% (IQ1) | 37.0% | 48.6% |
| Interquartile 75% (IQ3) | 46.7% | 66.9% |
| Interquartile Range (IQR) | 9.7% | 18.3% |
| Standard Deviation (Sample) | 9.1% | 17.4% |
| Standard Deviation (Population) | 9.0% | 17.3% |
Similar Demographics by Currently Married
Demographics Similar to Senegalese by Currently Married
In terms of currently married, the demographic groups most similar to Senegalese are Arapaho (40.5%, a difference of 0.040%), Barbadian (40.6%, a difference of 0.17%), U.S. Virgin Islander (40.7%, a difference of 0.31%), Immigrants from Senegal (40.7%, a difference of 0.36%), and Immigrants from West Indies (40.7%, a difference of 0.37%).
| Demographics | Rating | Rank | Currently Married |
| Immigrants | Jamaica | 0.0 /100 | #320 | Tragic 41.1% |
| Immigrants | Congo | 0.0 /100 | #321 | Tragic 41.1% |
| Immigrants | Haiti | 0.0 /100 | #322 | Tragic 41.0% |
| Immigrants | West Indies | 0.0 /100 | #323 | Tragic 40.7% |
| Immigrants | Senegal | 0.0 /100 | #324 | Tragic 40.7% |
| U.S. Virgin Islanders | 0.0 /100 | #325 | Tragic 40.7% |
| Barbadians | 0.0 /100 | #326 | Tragic 40.6% |
| Senegalese | 0.0 /100 | #327 | Tragic 40.6% |
| Arapaho | 0.0 /100 | #328 | Tragic 40.5% |
| Crow | 0.0 /100 | #329 | Tragic 40.4% |
| Immigrants | Dominica | 0.0 /100 | #330 | Tragic 40.3% |
| Immigrants | Barbados | 0.0 /100 | #331 | Tragic 40.3% |
| Immigrants | St. Vincent and the Grenadines | 0.0 /100 | #332 | Tragic 40.1% |
| Yup'ik | 0.0 /100 | #333 | Tragic 39.9% |
| Puerto Ricans | 0.0 /100 | #334 | Tragic 39.9% |
Demographics Similar to Immigrants from Europe by Currently Married
In terms of currently married, the demographic groups most similar to Immigrants from Europe are Immigrants from Sri Lanka (48.1%, a difference of 0.0%), Immigrants from Poland (48.1%, a difference of 0.010%), Bolivian (48.1%, a difference of 0.010%), Immigrants from Israel (48.1%, a difference of 0.010%), and Immigrants from South Africa (48.1%, a difference of 0.040%).
| Demographics | Rating | Rank | Currently Married |
| Immigrants | Belarus | 97.2 /100 | #75 | Exceptional 48.1% |
| Basques | 97.2 /100 | #76 | Exceptional 48.1% |
| Slovenes | 97.1 /100 | #77 | Exceptional 48.1% |
| Immigrants | Belgium | 97.1 /100 | #78 | Exceptional 48.1% |
| Immigrants | South Africa | 97.0 /100 | #79 | Exceptional 48.1% |
| Immigrants | Poland | 96.9 /100 | #80 | Exceptional 48.1% |
| Immigrants | Sri Lanka | 96.9 /100 | #81 | Exceptional 48.1% |
| Immigrants | Europe | 96.9 /100 | #82 | Exceptional 48.1% |
| Bolivians | 96.9 /100 | #83 | Exceptional 48.1% |
| Immigrants | Israel | 96.9 /100 | #84 | Exceptional 48.1% |
| French Canadians | 96.3 /100 | #85 | Exceptional 48.0% |
| Immigrants | Japan | 96.2 /100 | #86 | Exceptional 48.0% |
| Jordanians | 96.2 /100 | #87 | Exceptional 48.0% |
| Immigrants | Eastern Europe | 96.1 /100 | #88 | Exceptional 48.0% |
| Indians (Asian) | 95.8 /100 | #89 | Exceptional 48.0% |