Blackfeet vs Choctaw In Labor Force | Age 45-54
COMPARE
Blackfeet
Choctaw
In Labor Force | Age 45-54
In Labor Force | Age 45-54 Comparison
Blackfeet
Choctaw
80.0%
IN LABOR FORCE | AGE 45-54
0.0/ 100
METRIC RATING
307th/ 347
METRIC RANK
78.2%
IN LABOR FORCE | AGE 45-54
0.0/ 100
METRIC RATING
325th/ 347
METRIC RANK
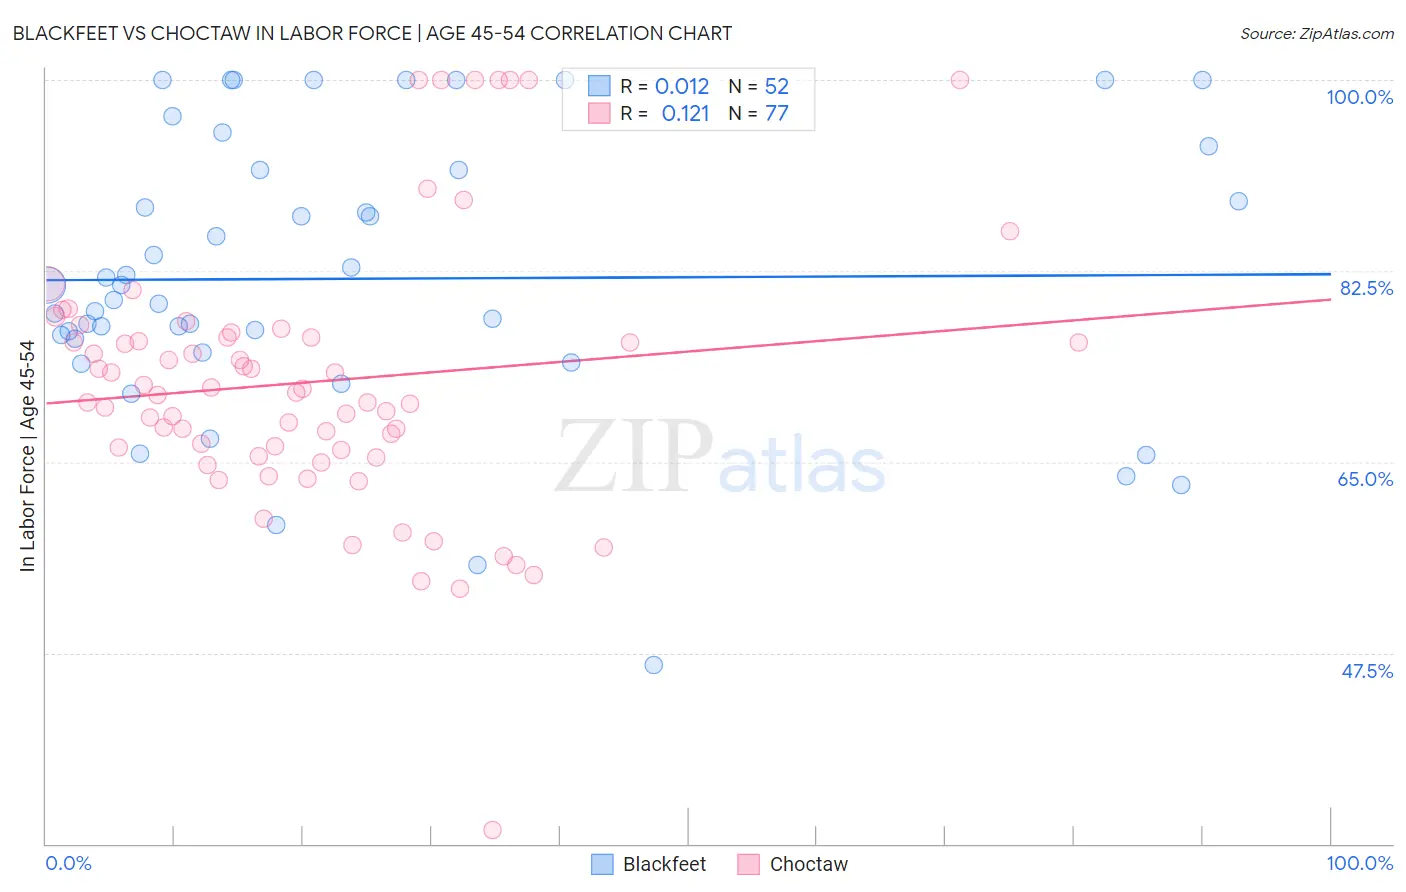
Blackfeet vs Choctaw In Labor Force | Age 45-54 Correlation Chart
The statistical analysis conducted on geographies consisting of 309,460,810 people shows no correlation between the proportion of Blackfeet and labor force participation rate among population between the ages 45 and 54 in the United States with a correlation coefficient (R) of 0.012 and weighted average of 80.0%. Similarly, the statistical analysis conducted on geographies consisting of 269,621,140 people shows a poor positive correlation between the proportion of Choctaw and labor force participation rate among population between the ages 45 and 54 in the United States with a correlation coefficient (R) of 0.121 and weighted average of 78.2%, a difference of 2.4%.
In Labor Force | Age 45-54 Correlation Summary
| Measurement | Blackfeet | Choctaw |
| Minimum | 46.4% | 31.3% |
| Maximum | 100.0% | 100.0% |
| Range | 53.6% | 68.7% |
| Mean | 81.8% | 72.4% |
| Median | 80.5% | 71.3% |
| Interquartile 25% (IQ1) | 75.6% | 65.8% |
| Interquartile 75% (IQ3) | 91.7% | 76.6% |
| Interquartile Range (IQR) | 16.1% | 10.8% |
| Standard Deviation (Sample) | 12.8% | 12.4% |
| Standard Deviation (Population) | 12.7% | 12.3% |
Demographics Similar to Blackfeet and Choctaw by In Labor Force | Age 45-54
In terms of in labor force | age 45-54, the demographic groups most similar to Blackfeet are Central American Indian (80.0%, a difference of 0.040%), Potawatomi (80.0%, a difference of 0.070%), Spanish American (80.1%, a difference of 0.080%), Inupiat (79.9%, a difference of 0.16%), and Mexican (79.8%, a difference of 0.26%). Similarly, the demographic groups most similar to Choctaw are Seminole (78.1%, a difference of 0.050%), Dutch West Indian (78.2%, a difference of 0.090%), Kiowa (78.3%, a difference of 0.11%), Crow (78.3%, a difference of 0.20%), and Yup'ik (78.6%, a difference of 0.61%).
| Demographics | Rating | Rank | In Labor Force | Age 45-54 |
| Spanish Americans | 0.0 /100 | #306 | Tragic 80.1% |
| Blackfeet | 0.0 /100 | #307 | Tragic 80.0% |
| Central American Indians | 0.0 /100 | #308 | Tragic 80.0% |
| Potawatomi | 0.0 /100 | #309 | Tragic 80.0% |
| Inupiat | 0.0 /100 | #310 | Tragic 79.9% |
| Mexicans | 0.0 /100 | #311 | Tragic 79.8% |
| Immigrants | Mexico | 0.0 /100 | #312 | Tragic 79.7% |
| Colville | 0.0 /100 | #313 | Tragic 79.5% |
| Ottawa | 0.0 /100 | #314 | Tragic 79.5% |
| Blacks/African Americans | 0.0 /100 | #315 | Tragic 79.3% |
| Shoshone | 0.0 /100 | #316 | Tragic 79.3% |
| Comanche | 0.0 /100 | #317 | Tragic 79.2% |
| Chickasaw | 0.0 /100 | #318 | Tragic 79.0% |
| Cherokee | 0.0 /100 | #319 | Tragic 79.0% |
| Yaqui | 0.0 /100 | #320 | Tragic 78.9% |
| Yup'ik | 0.0 /100 | #321 | Tragic 78.6% |
| Crow | 0.0 /100 | #322 | Tragic 78.3% |
| Kiowa | 0.0 /100 | #323 | Tragic 78.3% |
| Dutch West Indians | 0.0 /100 | #324 | Tragic 78.2% |
| Choctaw | 0.0 /100 | #325 | Tragic 78.2% |
| Seminole | 0.0 /100 | #326 | Tragic 78.1% |