Immigrants from Grenada vs Choctaw Currently Married
COMPARE
Immigrants from Grenada
Choctaw
Currently Married
Currently Married Comparison
Immigrants from Grenada
Choctaw
39.1%
CURRENTLY MARRIED
0.0/ 100
METRIC RATING
340th/ 347
METRIC RANK
46.3%
CURRENTLY MARRIED
29.1/ 100
METRIC RATING
190th/ 347
METRIC RANK
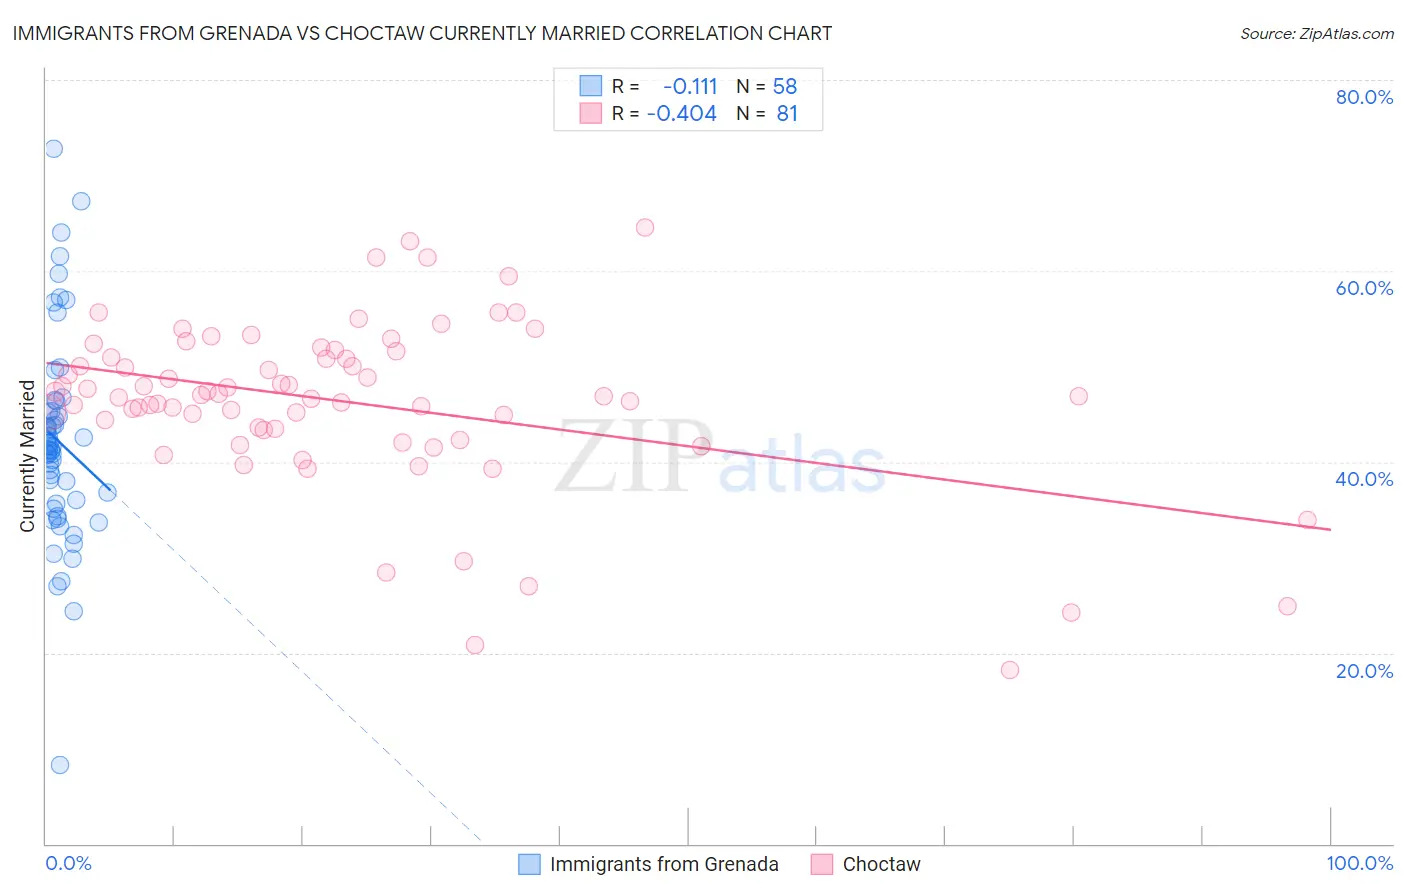
Immigrants from Grenada vs Choctaw Currently Married Correlation Chart
The statistical analysis conducted on geographies consisting of 67,201,096 people shows a poor negative correlation between the proportion of Immigrants from Grenada and percentage of population currently married in the United States with a correlation coefficient (R) of -0.111 and weighted average of 39.1%. Similarly, the statistical analysis conducted on geographies consisting of 269,717,873 people shows a moderate negative correlation between the proportion of Choctaw and percentage of population currently married in the United States with a correlation coefficient (R) of -0.404 and weighted average of 46.3%, a difference of 18.2%.
Currently Married Correlation Summary
| Measurement | Immigrants from Grenada | Choctaw |
| Minimum | 8.3% | 18.2% |
| Maximum | 72.8% | 64.5% |
| Range | 64.5% | 46.3% |
| Mean | 42.2% | 46.2% |
| Median | 41.4% | 46.9% |
| Interquartile 25% (IQ1) | 35.6% | 43.4% |
| Interquartile 75% (IQ3) | 45.4% | 51.3% |
| Interquartile Range (IQR) | 9.8% | 7.9% |
| Standard Deviation (Sample) | 10.9% | 8.8% |
| Standard Deviation (Population) | 10.8% | 8.7% |
Similar Demographics by Currently Married
Demographics Similar to Immigrants from Grenada by Currently Married
In terms of currently married, the demographic groups most similar to Immigrants from Grenada are Navajo (39.0%, a difference of 0.35%), Immigrants from Dominican Republic (38.9%, a difference of 0.52%), Dominican (39.5%, a difference of 0.96%), Cape Verdean (39.6%, a difference of 1.1%), and Black/African American (39.6%, a difference of 1.2%).
| Demographics | Rating | Rank | Currently Married |
| Yup'ik | 0.0 /100 | #333 | Tragic 39.9% |
| Puerto Ricans | 0.0 /100 | #334 | Tragic 39.9% |
| Lumbee | 0.0 /100 | #335 | Tragic 39.8% |
| British West Indians | 0.0 /100 | #336 | Tragic 39.8% |
| Blacks/African Americans | 0.0 /100 | #337 | Tragic 39.6% |
| Cape Verdeans | 0.0 /100 | #338 | Tragic 39.6% |
| Dominicans | 0.0 /100 | #339 | Tragic 39.5% |
| Immigrants | Grenada | 0.0 /100 | #340 | Tragic 39.1% |
| Navajo | 0.0 /100 | #341 | Tragic 39.0% |
| Immigrants | Dominican Republic | 0.0 /100 | #342 | Tragic 38.9% |
| Pueblo | 0.0 /100 | #343 | Tragic 38.2% |
| Immigrants | Cabo Verde | 0.0 /100 | #344 | Tragic 37.8% |
| Tohono O'odham | 0.0 /100 | #345 | Tragic 36.8% |
| Hopi | 0.0 /100 | #346 | Tragic 36.5% |
| Pima | 0.0 /100 | #347 | Tragic 35.9% |
Demographics Similar to Choctaw by Currently Married
In terms of currently married, the demographic groups most similar to Choctaw are Fijian (46.3%, a difference of 0.050%), Immigrants from France (46.2%, a difference of 0.060%), Colombian (46.3%, a difference of 0.12%), Soviet Union (46.2%, a difference of 0.16%), and Immigrants from Fiji (46.2%, a difference of 0.19%).
| Demographics | Rating | Rank | Currently Married |
| Immigrants | Northern Africa | 39.7 /100 | #183 | Fair 46.5% |
| Brazilians | 39.3 /100 | #184 | Fair 46.4% |
| Mongolians | 37.6 /100 | #185 | Fair 46.4% |
| Immigrants | Chile | 36.8 /100 | #186 | Fair 46.4% |
| Immigrants | Peru | 35.3 /100 | #187 | Fair 46.4% |
| Colombians | 31.8 /100 | #188 | Fair 46.3% |
| Fijians | 30.3 /100 | #189 | Fair 46.3% |
| Choctaw | 29.1 /100 | #190 | Fair 46.3% |
| Immigrants | France | 27.7 /100 | #191 | Fair 46.2% |
| Soviet Union | 25.7 /100 | #192 | Fair 46.2% |
| Immigrants | Fiji | 25.0 /100 | #193 | Fair 46.2% |
| South Americans | 23.8 /100 | #194 | Fair 46.1% |
| Immigrants | Nepal | 23.7 /100 | #195 | Fair 46.1% |
| Immigrants | Bosnia and Herzegovina | 22.2 /100 | #196 | Fair 46.1% |
| Immigrants | Kuwait | 21.7 /100 | #197 | Fair 46.1% |