Bhutanese vs Peruvian High School Diploma
COMPARE
Bhutanese
Peruvian
High School Diploma
High School Diploma Comparison
Bhutanese
Peruvians
91.2%
HIGH SCHOOL DIPLOMA
99.8/ 100
METRIC RATING
49th/ 347
METRIC RANK
87.8%
HIGH SCHOOL DIPLOMA
1.9/ 100
METRIC RATING
245th/ 347
METRIC RANK
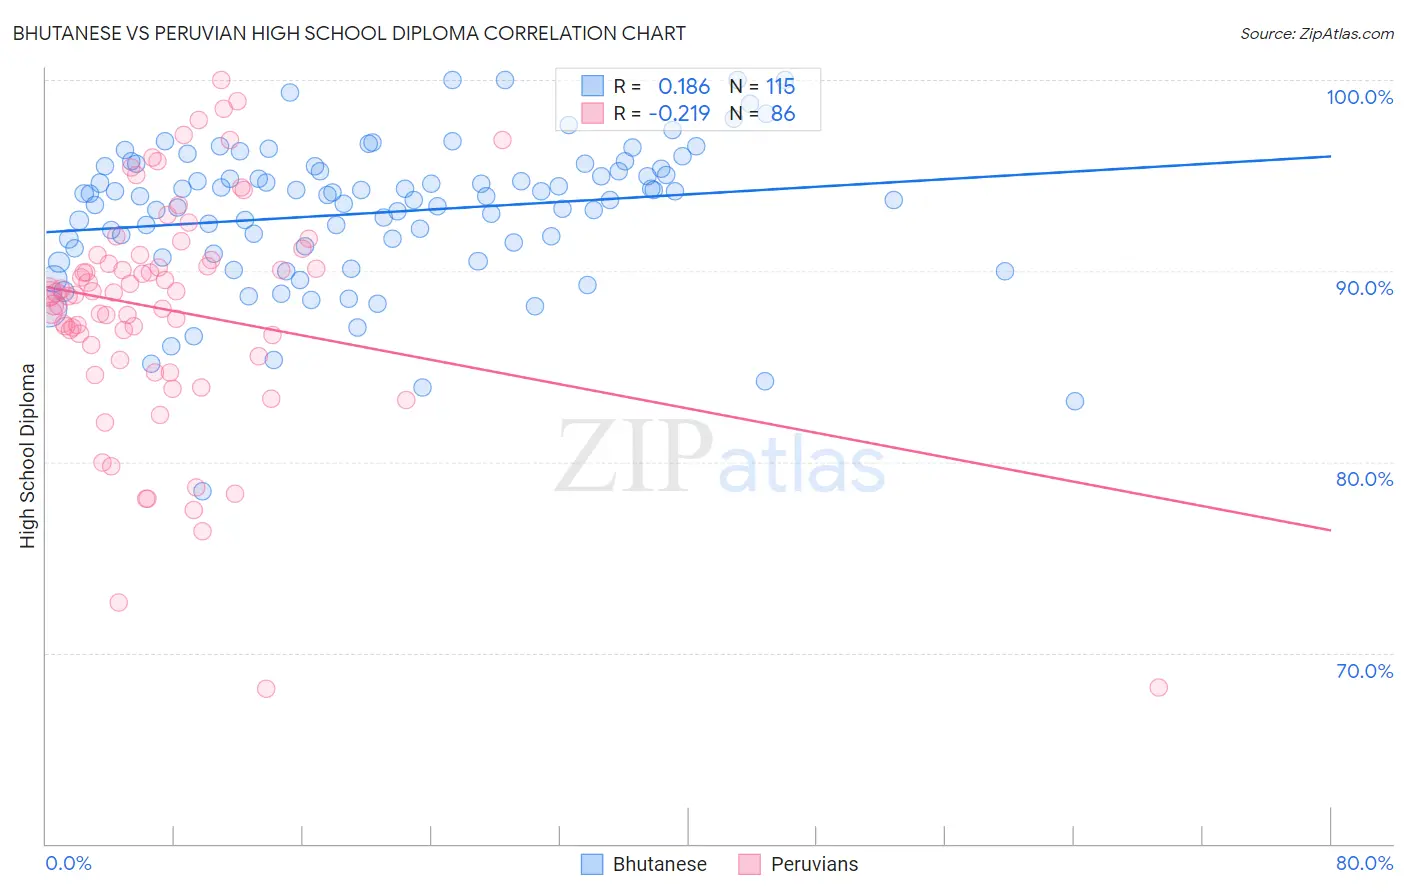
Bhutanese vs Peruvian High School Diploma Correlation Chart
The statistical analysis conducted on geographies consisting of 455,590,907 people shows a poor positive correlation between the proportion of Bhutanese and percentage of population with at least high school diploma education in the United States with a correlation coefficient (R) of 0.186 and weighted average of 91.2%. Similarly, the statistical analysis conducted on geographies consisting of 363,251,075 people shows a weak negative correlation between the proportion of Peruvians and percentage of population with at least high school diploma education in the United States with a correlation coefficient (R) of -0.219 and weighted average of 87.8%, a difference of 3.8%.
High School Diploma Correlation Summary
| Measurement | Bhutanese | Peruvian |
| Minimum | 78.4% | 68.1% |
| Maximum | 100.0% | 100.0% |
| Range | 21.6% | 31.9% |
| Mean | 93.1% | 87.9% |
| Median | 93.9% | 88.8% |
| Interquartile 25% (IQ1) | 91.2% | 85.5% |
| Interquartile 75% (IQ3) | 95.3% | 90.8% |
| Interquartile Range (IQR) | 4.1% | 5.3% |
| Standard Deviation (Sample) | 3.8% | 6.1% |
| Standard Deviation (Population) | 3.7% | 6.1% |
Similar Demographics by High School Diploma
Demographics Similar to Bhutanese by High School Diploma
In terms of high school diploma, the demographic groups most similar to Bhutanese are Australian (91.2%, a difference of 0.010%), Belgian (91.2%, a difference of 0.010%), Greek (91.2%, a difference of 0.020%), Welsh (91.2%, a difference of 0.020%), and Immigrants from Austria (91.3%, a difference of 0.060%).
| Demographics | Rating | Rank | High School Diploma |
| Northern Europeans | 99.8 /100 | #42 | Exceptional 91.3% |
| British | 99.8 /100 | #43 | Exceptional 91.3% |
| Immigrants | Austria | 99.8 /100 | #44 | Exceptional 91.3% |
| Turks | 99.8 /100 | #45 | Exceptional 91.2% |
| Greeks | 99.8 /100 | #46 | Exceptional 91.2% |
| Australians | 99.8 /100 | #47 | Exceptional 91.2% |
| Belgians | 99.8 /100 | #48 | Exceptional 91.2% |
| Bhutanese | 99.8 /100 | #49 | Exceptional 91.2% |
| Welsh | 99.8 /100 | #50 | Exceptional 91.2% |
| New Zealanders | 99.7 /100 | #51 | Exceptional 91.1% |
| Immigrants | Sweden | 99.7 /100 | #52 | Exceptional 91.1% |
| Immigrants | Belgium | 99.7 /100 | #53 | Exceptional 91.1% |
| Macedonians | 99.7 /100 | #54 | Exceptional 91.1% |
| Serbians | 99.7 /100 | #55 | Exceptional 91.1% |
| Immigrants | Canada | 99.7 /100 | #56 | Exceptional 91.1% |
Demographics Similar to Peruvians by High School Diploma
In terms of high school diploma, the demographic groups most similar to Peruvians are Immigrants from Philippines (87.8%, a difference of 0.010%), Choctaw (87.8%, a difference of 0.010%), Immigrants from Eritrea (87.8%, a difference of 0.030%), Immigrants from Uzbekistan (87.8%, a difference of 0.040%), and Cheyenne (87.8%, a difference of 0.040%).
| Demographics | Rating | Rank | High School Diploma |
| Sioux | 2.7 /100 | #238 | Tragic 87.9% |
| South Americans | 2.7 /100 | #239 | Tragic 87.9% |
| Comanche | 2.2 /100 | #240 | Tragic 87.9% |
| Immigrants | Uzbekistan | 2.1 /100 | #241 | Tragic 87.8% |
| Cheyenne | 2.1 /100 | #242 | Tragic 87.8% |
| Immigrants | Philippines | 1.9 /100 | #243 | Tragic 87.8% |
| Choctaw | 1.9 /100 | #244 | Tragic 87.8% |
| Peruvians | 1.9 /100 | #245 | Tragic 87.8% |
| Immigrants | Eritrea | 1.7 /100 | #246 | Tragic 87.8% |
| Immigrants | Costa Rica | 1.7 /100 | #247 | Tragic 87.8% |
| Spanish Americans | 1.5 /100 | #248 | Tragic 87.7% |
| Senegalese | 1.5 /100 | #249 | Tragic 87.7% |
| Immigrants | Nigeria | 1.5 /100 | #250 | Tragic 87.7% |
| Ghanaians | 1.4 /100 | #251 | Tragic 87.7% |
| Immigrants | South America | 1.2 /100 | #252 | Tragic 87.6% |