Bhutanese vs Panamanian Single Mother Households
COMPARE
Bhutanese
Panamanian
Single Mother Households
Single Mother Households Comparison
Bhutanese
Panamanians
5.3%
SINGLE MOTHER HOUSEHOLDS
99.7/ 100
METRIC RATING
27th/ 347
METRIC RANK
7.1%
SINGLE MOTHER HOUSEHOLDS
0.9/ 100
METRIC RATING
238th/ 347
METRIC RANK
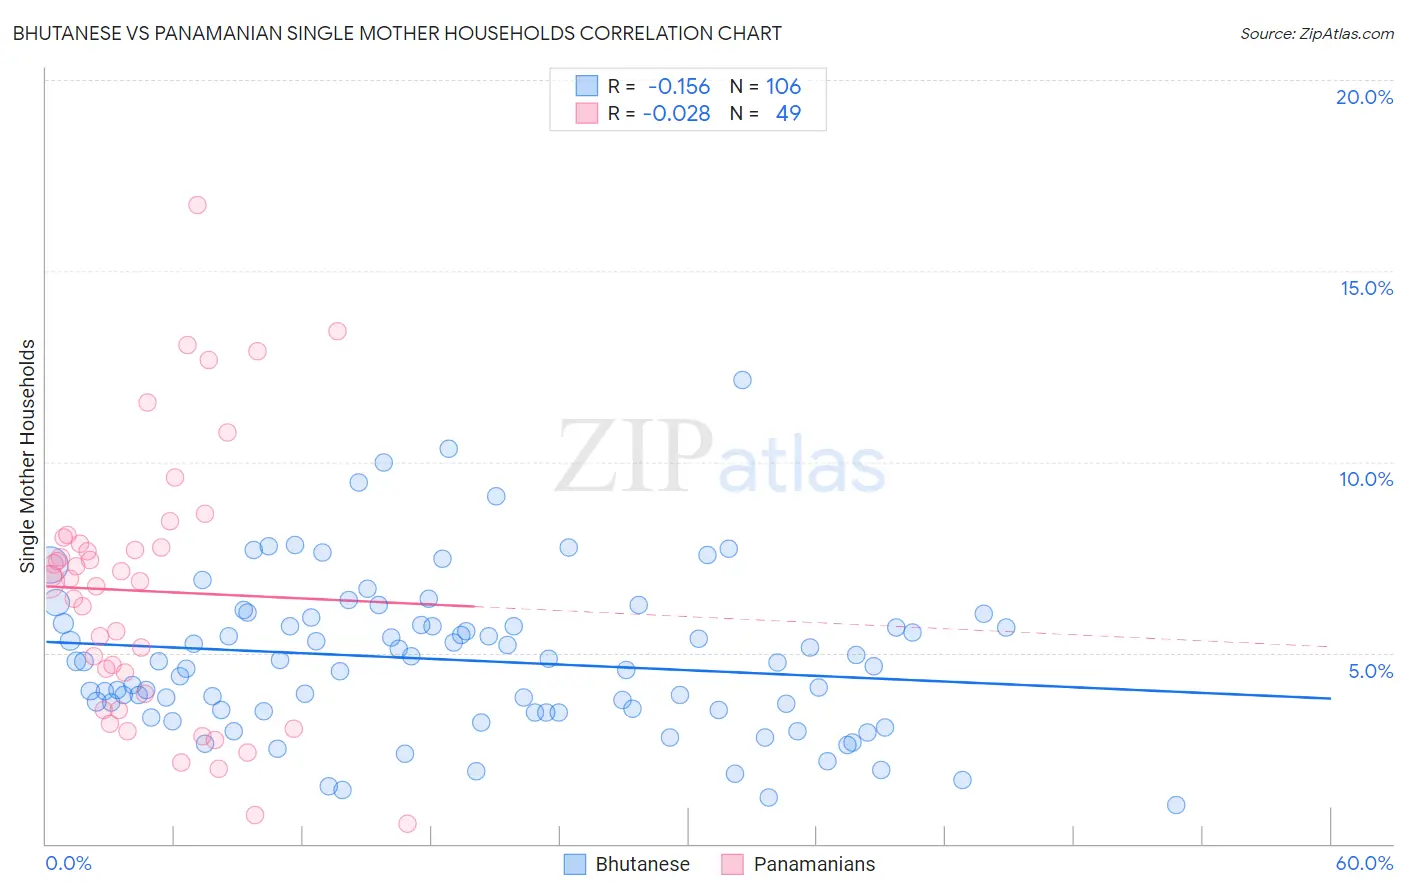
Bhutanese vs Panamanian Single Mother Households Correlation Chart
The statistical analysis conducted on geographies consisting of 453,820,628 people shows a poor negative correlation between the proportion of Bhutanese and percentage of single mother households in the United States with a correlation coefficient (R) of -0.156 and weighted average of 5.3%. Similarly, the statistical analysis conducted on geographies consisting of 280,762,519 people shows no correlation between the proportion of Panamanians and percentage of single mother households in the United States with a correlation coefficient (R) of -0.028 and weighted average of 7.1%, a difference of 34.9%.
Single Mother Households Correlation Summary
| Measurement | Bhutanese | Panamanian |
| Minimum | 1.0% | 0.51% |
| Maximum | 12.1% | 16.7% |
| Range | 11.1% | 16.2% |
| Mean | 4.8% | 6.6% |
| Median | 4.8% | 6.9% |
| Interquartile 25% (IQ1) | 3.5% | 3.7% |
| Interquartile 75% (IQ3) | 5.7% | 7.9% |
| Interquartile Range (IQR) | 2.3% | 4.2% |
| Standard Deviation (Sample) | 2.0% | 3.5% |
| Standard Deviation (Population) | 2.0% | 3.5% |
Similar Demographics by Single Mother Households
Demographics Similar to Bhutanese by Single Mother Households
In terms of single mother households, the demographic groups most similar to Bhutanese are Russian (5.3%, a difference of 0.10%), Latvian (5.3%, a difference of 0.12%), Burmese (5.3%, a difference of 0.18%), Immigrants from Korea (5.3%, a difference of 0.18%), and Cambodian (5.3%, a difference of 0.19%).
| Demographics | Rating | Rank | Single Mother Households |
| Maltese | 99.9 /100 | #20 | Exceptional 5.2% |
| Eastern Europeans | 99.8 /100 | #21 | Exceptional 5.2% |
| Thais | 99.8 /100 | #22 | Exceptional 5.2% |
| Immigrants | Austria | 99.8 /100 | #23 | Exceptional 5.2% |
| Armenians | 99.8 /100 | #24 | Exceptional 5.2% |
| Immigrants | Japan | 99.8 /100 | #25 | Exceptional 5.2% |
| Immigrants | Lithuania | 99.8 /100 | #26 | Exceptional 5.3% |
| Bhutanese | 99.7 /100 | #27 | Exceptional 5.3% |
| Russians | 99.7 /100 | #28 | Exceptional 5.3% |
| Latvians | 99.7 /100 | #29 | Exceptional 5.3% |
| Burmese | 99.7 /100 | #30 | Exceptional 5.3% |
| Immigrants | Korea | 99.7 /100 | #31 | Exceptional 5.3% |
| Cambodians | 99.7 /100 | #32 | Exceptional 5.3% |
| Immigrants | Switzerland | 99.7 /100 | #33 | Exceptional 5.3% |
| Bulgarians | 99.7 /100 | #34 | Exceptional 5.3% |
Demographics Similar to Panamanians by Single Mother Households
In terms of single mother households, the demographic groups most similar to Panamanians are Arapaho (7.1%, a difference of 0.14%), Ute (7.1%, a difference of 0.23%), Kiowa (7.1%, a difference of 0.27%), Immigrants from Panama (7.2%, a difference of 0.59%), and Immigrants from Portugal (7.2%, a difference of 0.94%).
| Demographics | Rating | Rank | Single Mother Households |
| Spanish Americans | 1.6 /100 | #231 | Tragic 7.0% |
| Comanche | 1.5 /100 | #232 | Tragic 7.0% |
| Choctaw | 1.4 /100 | #233 | Tragic 7.0% |
| Chickasaw | 1.4 /100 | #234 | Tragic 7.0% |
| Immigrants | Burma/Myanmar | 1.4 /100 | #235 | Tragic 7.0% |
| Ute | 1.0 /100 | #236 | Tragic 7.1% |
| Arapaho | 1.0 /100 | #237 | Tragic 7.1% |
| Panamanians | 0.9 /100 | #238 | Tragic 7.1% |
| Kiowa | 0.8 /100 | #239 | Tragic 7.1% |
| Immigrants | Panama | 0.7 /100 | #240 | Tragic 7.2% |
| Immigrants | Portugal | 0.6 /100 | #241 | Tragic 7.2% |
| Fijians | 0.6 /100 | #242 | Tragic 7.2% |
| Ecuadorians | 0.6 /100 | #243 | Tragic 7.2% |
| Cubans | 0.6 /100 | #244 | Tragic 7.2% |
| Immigrants | Cambodia | 0.5 /100 | #245 | Tragic 7.2% |