Bhutanese vs Immigrants from Singapore Single Mother Households
COMPARE
Bhutanese
Immigrants from Singapore
Single Mother Households
Single Mother Households Comparison
Bhutanese
Immigrants from Singapore
5.3%
SINGLE MOTHER HOUSEHOLDS
99.7/ 100
METRIC RATING
27th/ 347
METRIC RANK
5.0%
SINGLE MOTHER HOUSEHOLDS
100.0/ 100
METRIC RATING
6th/ 347
METRIC RANK
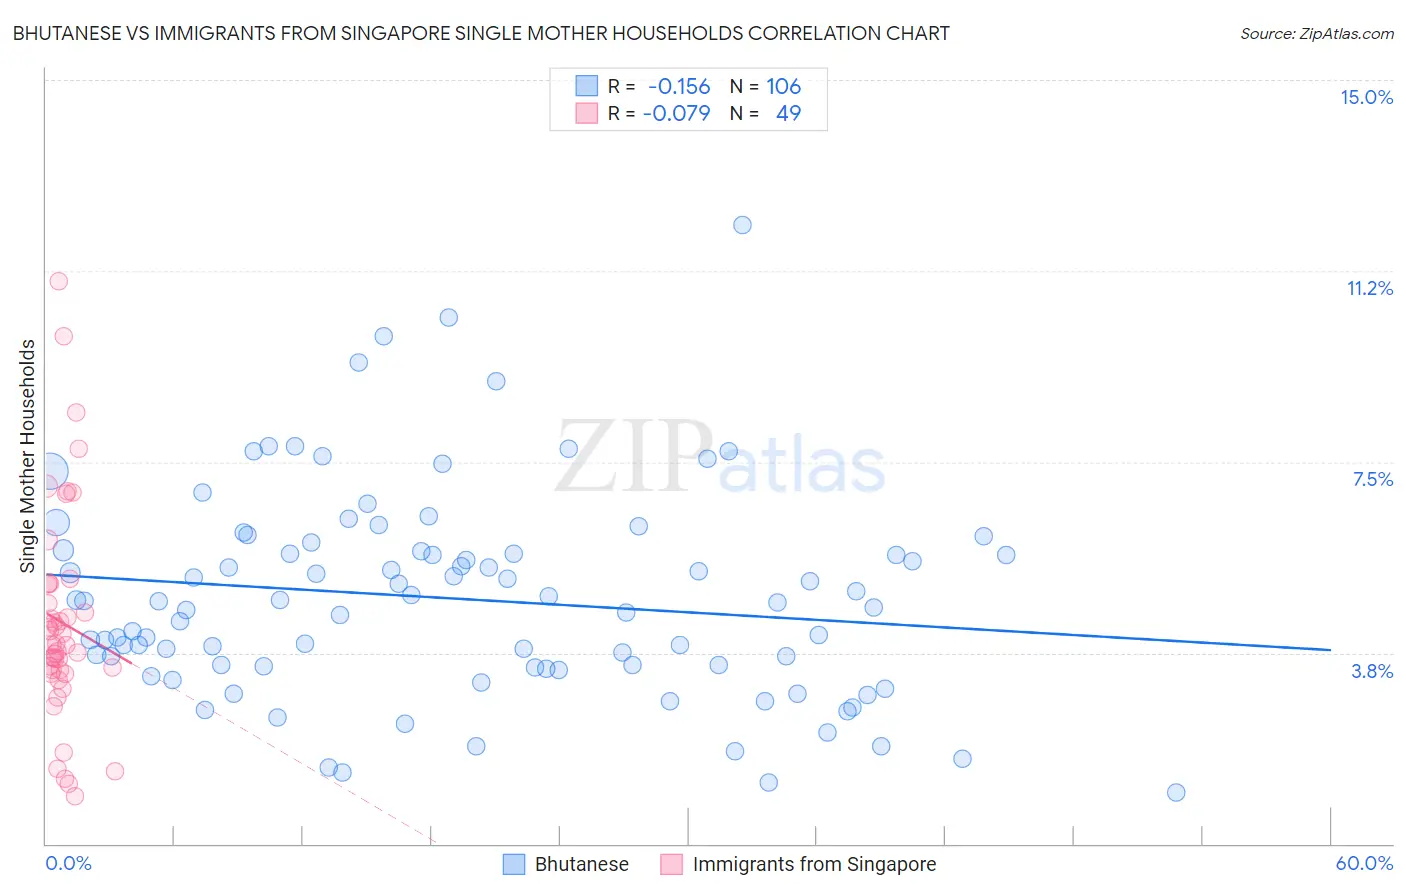
Bhutanese vs Immigrants from Singapore Single Mother Households Correlation Chart
The statistical analysis conducted on geographies consisting of 453,820,628 people shows a poor negative correlation between the proportion of Bhutanese and percentage of single mother households in the United States with a correlation coefficient (R) of -0.156 and weighted average of 5.3%. Similarly, the statistical analysis conducted on geographies consisting of 137,315,174 people shows a slight negative correlation between the proportion of Immigrants from Singapore and percentage of single mother households in the United States with a correlation coefficient (R) of -0.079 and weighted average of 5.0%, a difference of 6.4%.
Single Mother Households Correlation Summary
| Measurement | Bhutanese | Immigrants from Singapore |
| Minimum | 1.0% | 0.93% |
| Maximum | 12.1% | 11.0% |
| Range | 11.1% | 10.1% |
| Mean | 4.8% | 4.3% |
| Median | 4.8% | 3.9% |
| Interquartile 25% (IQ1) | 3.5% | 3.4% |
| Interquartile 75% (IQ3) | 5.7% | 5.1% |
| Interquartile Range (IQR) | 2.3% | 1.7% |
| Standard Deviation (Sample) | 2.0% | 2.1% |
| Standard Deviation (Population) | 2.0% | 2.1% |
Similar Demographics by Single Mother Households
Demographics Similar to Bhutanese by Single Mother Households
In terms of single mother households, the demographic groups most similar to Bhutanese are Russian (5.3%, a difference of 0.10%), Latvian (5.3%, a difference of 0.12%), Burmese (5.3%, a difference of 0.18%), Immigrants from Korea (5.3%, a difference of 0.18%), and Cambodian (5.3%, a difference of 0.19%).
| Demographics | Rating | Rank | Single Mother Households |
| Maltese | 99.9 /100 | #20 | Exceptional 5.2% |
| Eastern Europeans | 99.8 /100 | #21 | Exceptional 5.2% |
| Thais | 99.8 /100 | #22 | Exceptional 5.2% |
| Immigrants | Austria | 99.8 /100 | #23 | Exceptional 5.2% |
| Armenians | 99.8 /100 | #24 | Exceptional 5.2% |
| Immigrants | Japan | 99.8 /100 | #25 | Exceptional 5.2% |
| Immigrants | Lithuania | 99.8 /100 | #26 | Exceptional 5.3% |
| Bhutanese | 99.7 /100 | #27 | Exceptional 5.3% |
| Russians | 99.7 /100 | #28 | Exceptional 5.3% |
| Latvians | 99.7 /100 | #29 | Exceptional 5.3% |
| Burmese | 99.7 /100 | #30 | Exceptional 5.3% |
| Immigrants | Korea | 99.7 /100 | #31 | Exceptional 5.3% |
| Cambodians | 99.7 /100 | #32 | Exceptional 5.3% |
| Immigrants | Switzerland | 99.7 /100 | #33 | Exceptional 5.3% |
| Bulgarians | 99.7 /100 | #34 | Exceptional 5.3% |
Demographics Similar to Immigrants from Singapore by Single Mother Households
In terms of single mother households, the demographic groups most similar to Immigrants from Singapore are Iranian (5.0%, a difference of 0.25%), Immigrants from Ireland (5.0%, a difference of 0.91%), Okinawan (5.0%, a difference of 1.1%), Immigrants from Israel (5.0%, a difference of 1.4%), and Immigrants from China (5.1%, a difference of 2.0%).
| Demographics | Rating | Rank | Single Mother Households |
| Immigrants | Taiwan | 100.0 /100 | #1 | Exceptional 4.7% |
| Filipinos | 100.0 /100 | #2 | Exceptional 4.7% |
| Immigrants | Iran | 100.0 /100 | #3 | Exceptional 4.8% |
| Assyrians/Chaldeans/Syriacs | 100.0 /100 | #4 | Exceptional 4.8% |
| Immigrants | Hong Kong | 100.0 /100 | #5 | Exceptional 4.8% |
| Immigrants | Singapore | 100.0 /100 | #6 | Exceptional 5.0% |
| Iranians | 100.0 /100 | #7 | Exceptional 5.0% |
| Immigrants | Ireland | 99.9 /100 | #8 | Exceptional 5.0% |
| Okinawans | 99.9 /100 | #9 | Exceptional 5.0% |
| Immigrants | Israel | 99.9 /100 | #10 | Exceptional 5.0% |
| Immigrants | China | 99.9 /100 | #11 | Exceptional 5.1% |
| Cypriots | 99.9 /100 | #12 | Exceptional 5.1% |
| Immigrants | India | 99.9 /100 | #13 | Exceptional 5.1% |
| Immigrants | Australia | 99.9 /100 | #14 | Exceptional 5.1% |
| Immigrants | Eastern Asia | 99.9 /100 | #15 | Exceptional 5.1% |