Bhutanese vs Vietnamese Single Mother Households
COMPARE
Bhutanese
Vietnamese
Single Mother Households
Single Mother Households Comparison
Bhutanese
Vietnamese
5.3%
SINGLE MOTHER HOUSEHOLDS
99.7/ 100
METRIC RATING
27th/ 347
METRIC RANK
6.7%
SINGLE MOTHER HOUSEHOLDS
11.3/ 100
METRIC RATING
208th/ 347
METRIC RANK
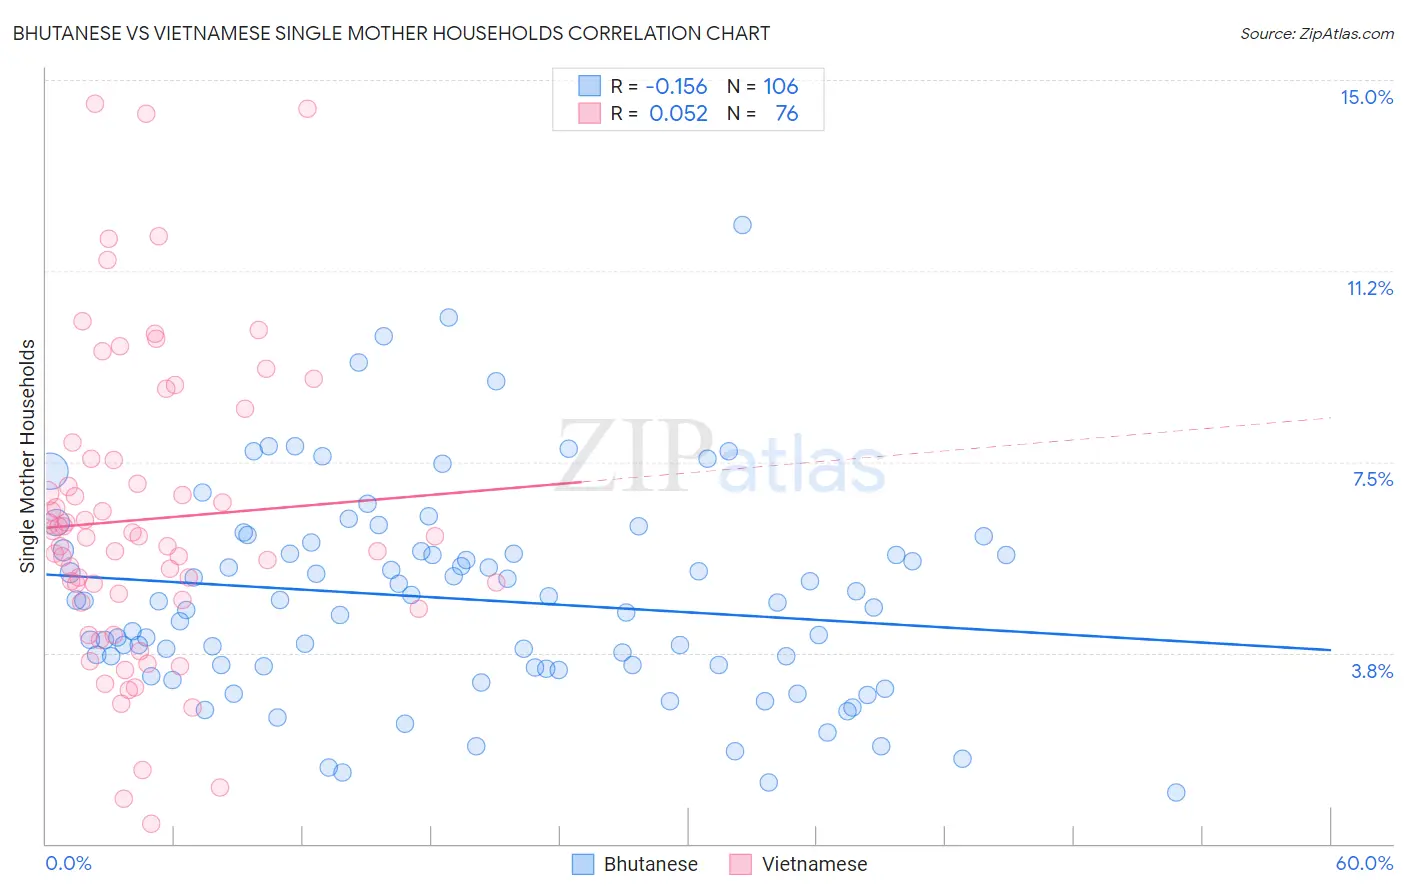
Bhutanese vs Vietnamese Single Mother Households Correlation Chart
The statistical analysis conducted on geographies consisting of 453,820,628 people shows a poor negative correlation between the proportion of Bhutanese and percentage of single mother households in the United States with a correlation coefficient (R) of -0.156 and weighted average of 5.3%. Similarly, the statistical analysis conducted on geographies consisting of 170,499,454 people shows a slight positive correlation between the proportion of Vietnamese and percentage of single mother households in the United States with a correlation coefficient (R) of 0.052 and weighted average of 6.7%, a difference of 26.3%.
Single Mother Households Correlation Summary
| Measurement | Bhutanese | Vietnamese |
| Minimum | 1.0% | 0.40% |
| Maximum | 12.1% | 14.5% |
| Range | 11.1% | 14.1% |
| Mean | 4.8% | 6.4% |
| Median | 4.8% | 6.0% |
| Interquartile 25% (IQ1) | 3.5% | 4.8% |
| Interquartile 75% (IQ3) | 5.7% | 7.6% |
| Interquartile Range (IQR) | 2.3% | 2.8% |
| Standard Deviation (Sample) | 2.0% | 3.0% |
| Standard Deviation (Population) | 2.0% | 2.9% |
Similar Demographics by Single Mother Households
Demographics Similar to Bhutanese by Single Mother Households
In terms of single mother households, the demographic groups most similar to Bhutanese are Russian (5.3%, a difference of 0.10%), Latvian (5.3%, a difference of 0.12%), Burmese (5.3%, a difference of 0.18%), Immigrants from Korea (5.3%, a difference of 0.18%), and Cambodian (5.3%, a difference of 0.19%).
| Demographics | Rating | Rank | Single Mother Households |
| Maltese | 99.9 /100 | #20 | Exceptional 5.2% |
| Eastern Europeans | 99.8 /100 | #21 | Exceptional 5.2% |
| Thais | 99.8 /100 | #22 | Exceptional 5.2% |
| Immigrants | Austria | 99.8 /100 | #23 | Exceptional 5.2% |
| Armenians | 99.8 /100 | #24 | Exceptional 5.2% |
| Immigrants | Japan | 99.8 /100 | #25 | Exceptional 5.2% |
| Immigrants | Lithuania | 99.8 /100 | #26 | Exceptional 5.3% |
| Bhutanese | 99.7 /100 | #27 | Exceptional 5.3% |
| Russians | 99.7 /100 | #28 | Exceptional 5.3% |
| Latvians | 99.7 /100 | #29 | Exceptional 5.3% |
| Burmese | 99.7 /100 | #30 | Exceptional 5.3% |
| Immigrants | Korea | 99.7 /100 | #31 | Exceptional 5.3% |
| Cambodians | 99.7 /100 | #32 | Exceptional 5.3% |
| Immigrants | Switzerland | 99.7 /100 | #33 | Exceptional 5.3% |
| Bulgarians | 99.7 /100 | #34 | Exceptional 5.3% |
Demographics Similar to Vietnamese by Single Mother Households
In terms of single mother households, the demographic groups most similar to Vietnamese are German Russian (6.7%, a difference of 0.050%), Immigrants from South America (6.7%, a difference of 0.050%), Cree (6.7%, a difference of 0.14%), Immigrants from Fiji (6.7%, a difference of 0.15%), and Immigrants from Peru (6.7%, a difference of 0.17%).
| Demographics | Rating | Rank | Single Mother Households |
| Venezuelans | 12.9 /100 | #201 | Poor 6.6% |
| Guamanians/Chamorros | 12.4 /100 | #202 | Poor 6.6% |
| Immigrants | Peru | 12.0 /100 | #203 | Poor 6.7% |
| Immigrants | Fiji | 11.9 /100 | #204 | Poor 6.7% |
| Cree | 11.9 /100 | #205 | Poor 6.7% |
| German Russians | 11.5 /100 | #206 | Poor 6.7% |
| Immigrants | South America | 11.5 /100 | #207 | Poor 6.7% |
| Vietnamese | 11.3 /100 | #208 | Poor 6.7% |
| Immigrants | Colombia | 10.5 /100 | #209 | Poor 6.7% |
| Immigrants | Nonimmigrants | 10.4 /100 | #210 | Poor 6.7% |
| Immigrants | Venezuela | 8.5 /100 | #211 | Tragic 6.7% |
| Immigrants | Eritrea | 8.4 /100 | #212 | Tragic 6.7% |
| Immigrants | Costa Rica | 8.2 /100 | #213 | Tragic 6.7% |
| Immigrants | Uruguay | 7.9 /100 | #214 | Tragic 6.7% |
| Shoshone | 5.7 /100 | #215 | Tragic 6.8% |