Bhutanese vs Arab Single Mother Households
COMPARE
Bhutanese
Arab
Single Mother Households
Single Mother Households Comparison
Bhutanese
Arabs
5.3%
SINGLE MOTHER HOUSEHOLDS
99.7/ 100
METRIC RATING
27th/ 347
METRIC RANK
6.0%
SINGLE MOTHER HOUSEHOLDS
84.0/ 100
METRIC RATING
145th/ 347
METRIC RANK
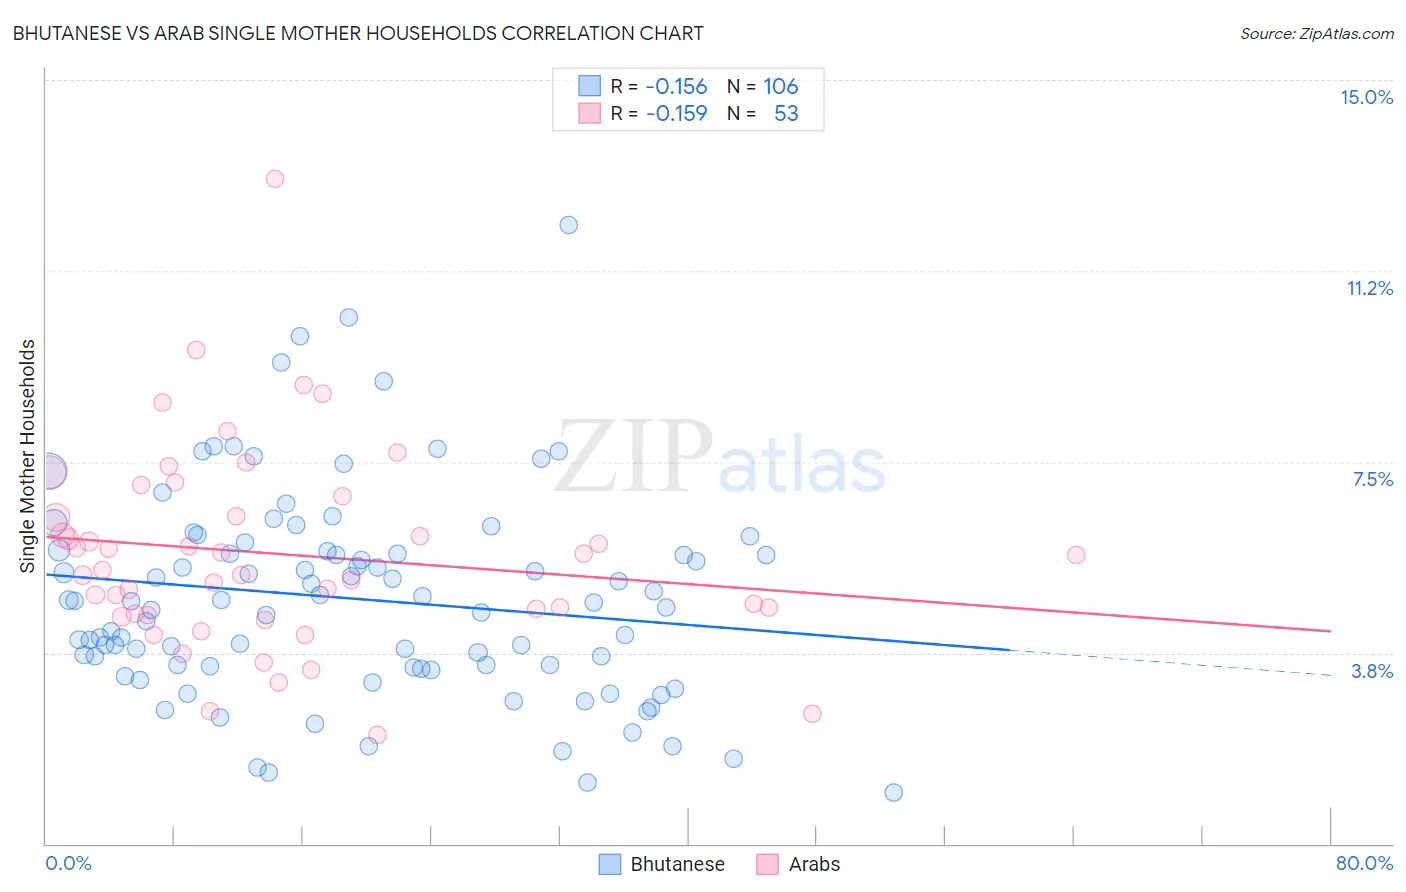
Bhutanese vs Arab Single Mother Households Correlation Chart
The statistical analysis conducted on geographies consisting of 453,820,628 people shows a poor negative correlation between the proportion of Bhutanese and percentage of single mother households in the United States with a correlation coefficient (R) of -0.156 and weighted average of 5.3%. Similarly, the statistical analysis conducted on geographies consisting of 484,798,237 people shows a poor negative correlation between the proportion of Arabs and percentage of single mother households in the United States with a correlation coefficient (R) of -0.159 and weighted average of 6.0%, a difference of 14.1%.
Single Mother Households Correlation Summary
| Measurement | Bhutanese | Arab |
| Minimum | 1.0% | 2.1% |
| Maximum | 12.1% | 13.1% |
| Range | 11.1% | 10.9% |
| Mean | 4.8% | 5.7% |
| Median | 4.8% | 5.4% |
| Interquartile 25% (IQ1) | 3.5% | 4.5% |
| Interquartile 75% (IQ3) | 5.7% | 6.6% |
| Interquartile Range (IQR) | 2.3% | 2.1% |
| Standard Deviation (Sample) | 2.0% | 2.0% |
| Standard Deviation (Population) | 2.0% | 1.9% |
Similar Demographics by Single Mother Households
Demographics Similar to Bhutanese by Single Mother Households
In terms of single mother households, the demographic groups most similar to Bhutanese are Russian (5.3%, a difference of 0.10%), Latvian (5.3%, a difference of 0.12%), Burmese (5.3%, a difference of 0.18%), Immigrants from Korea (5.3%, a difference of 0.18%), and Cambodian (5.3%, a difference of 0.19%).
| Demographics | Rating | Rank | Single Mother Households |
| Maltese | 99.9 /100 | #20 | Exceptional 5.2% |
| Eastern Europeans | 99.8 /100 | #21 | Exceptional 5.2% |
| Thais | 99.8 /100 | #22 | Exceptional 5.2% |
| Immigrants | Austria | 99.8 /100 | #23 | Exceptional 5.2% |
| Armenians | 99.8 /100 | #24 | Exceptional 5.2% |
| Immigrants | Japan | 99.8 /100 | #25 | Exceptional 5.2% |
| Immigrants | Lithuania | 99.8 /100 | #26 | Exceptional 5.3% |
| Bhutanese | 99.7 /100 | #27 | Exceptional 5.3% |
| Russians | 99.7 /100 | #28 | Exceptional 5.3% |
| Latvians | 99.7 /100 | #29 | Exceptional 5.3% |
| Burmese | 99.7 /100 | #30 | Exceptional 5.3% |
| Immigrants | Korea | 99.7 /100 | #31 | Exceptional 5.3% |
| Cambodians | 99.7 /100 | #32 | Exceptional 5.3% |
| Immigrants | Switzerland | 99.7 /100 | #33 | Exceptional 5.3% |
| Bulgarians | 99.7 /100 | #34 | Exceptional 5.3% |
Demographics Similar to Arabs by Single Mother Households
In terms of single mother households, the demographic groups most similar to Arabs are Korean (6.0%, a difference of 0.090%), Immigrants from Iraq (6.0%, a difference of 0.19%), Immigrants from Egypt (6.0%, a difference of 0.23%), Tsimshian (6.0%, a difference of 0.28%), and French Canadian (6.0%, a difference of 0.29%).
| Demographics | Rating | Rank | Single Mother Households |
| Icelanders | 86.9 /100 | #138 | Excellent 6.0% |
| Syrians | 86.0 /100 | #139 | Excellent 6.0% |
| French | 85.7 /100 | #140 | Excellent 6.0% |
| Tsimshian | 85.2 /100 | #141 | Excellent 6.0% |
| Immigrants | Egypt | 85.0 /100 | #142 | Excellent 6.0% |
| Immigrants | Iraq | 84.8 /100 | #143 | Excellent 6.0% |
| Koreans | 84.4 /100 | #144 | Excellent 6.0% |
| Arabs | 84.0 /100 | #145 | Excellent 6.0% |
| French Canadians | 82.6 /100 | #146 | Excellent 6.0% |
| Immigrants | Jordan | 82.3 /100 | #147 | Excellent 6.0% |
| Scotch-Irish | 82.0 /100 | #148 | Excellent 6.0% |
| Immigrants | Albania | 81.5 /100 | #149 | Excellent 6.1% |
| Zimbabweans | 80.7 /100 | #150 | Excellent 6.1% |
| Immigrants | Southern Europe | 80.5 /100 | #151 | Excellent 6.1% |
| Pakistanis | 79.2 /100 | #152 | Good 6.1% |