Senegalese vs Immigrants from Denmark Divorced or Separated
COMPARE
Senegalese
Immigrants from Denmark
Divorced or Separated
Divorced or Separated Comparison
Senegalese
Immigrants from Denmark
12.6%
DIVORCED OR SEPARATED
0.8/ 100
METRIC RATING
254th/ 347
METRIC RANK
11.6%
DIVORCED OR SEPARATED
98.9/ 100
METRIC RATING
92nd/ 347
METRIC RANK
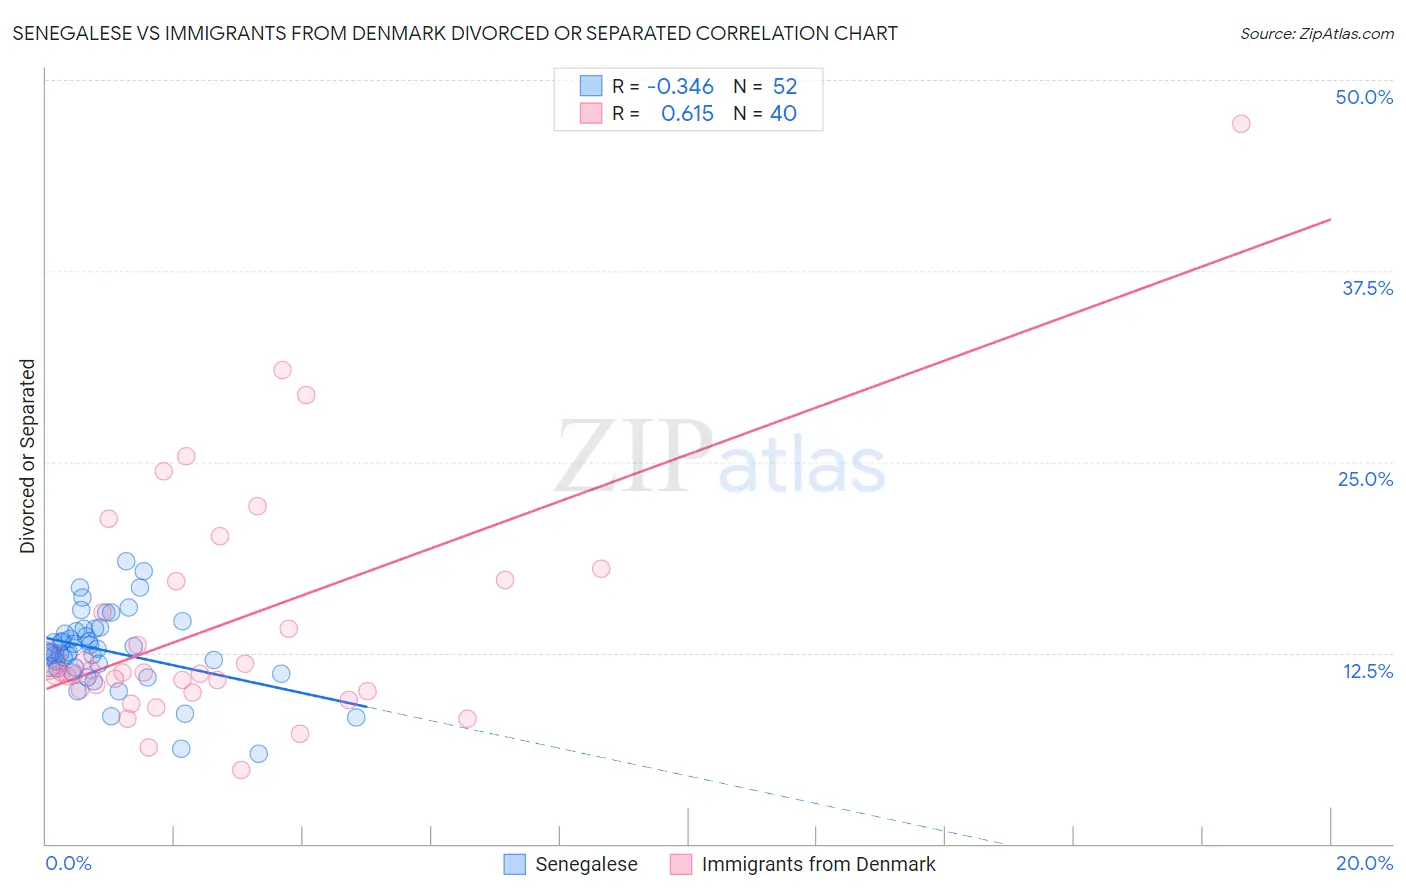
Senegalese vs Immigrants from Denmark Divorced or Separated Correlation Chart
The statistical analysis conducted on geographies consisting of 78,107,305 people shows a mild negative correlation between the proportion of Senegalese and percentage of population currently divorced or separated in the United States with a correlation coefficient (R) of -0.346 and weighted average of 12.6%. Similarly, the statistical analysis conducted on geographies consisting of 136,412,843 people shows a significant positive correlation between the proportion of Immigrants from Denmark and percentage of population currently divorced or separated in the United States with a correlation coefficient (R) of 0.615 and weighted average of 11.6%, a difference of 8.4%.
Divorced or Separated Correlation Summary
| Measurement | Senegalese | Immigrants from Denmark |
| Minimum | 5.9% | 4.8% |
| Maximum | 18.5% | 47.1% |
| Range | 12.6% | 42.3% |
| Mean | 12.6% | 14.4% |
| Median | 12.5% | 11.2% |
| Interquartile 25% (IQ1) | 11.5% | 10.0% |
| Interquartile 75% (IQ3) | 14.0% | 17.2% |
| Interquartile Range (IQR) | 2.5% | 7.2% |
| Standard Deviation (Sample) | 2.5% | 8.1% |
| Standard Deviation (Population) | 2.5% | 8.0% |
Similar Demographics by Divorced or Separated
Demographics Similar to Senegalese by Divorced or Separated
In terms of divorced or separated, the demographic groups most similar to Senegalese are Liberian (12.6%, a difference of 0.060%), Somali (12.6%, a difference of 0.060%), Welsh (12.6%, a difference of 0.10%), Immigrants from Colombia (12.6%, a difference of 0.26%), and Immigrants from Somalia (12.6%, a difference of 0.27%).
| Demographics | Rating | Rank | Divorced or Separated |
| Germans | 1.8 /100 | #247 | Tragic 12.5% |
| Nepalese | 1.8 /100 | #248 | Tragic 12.5% |
| Finns | 1.8 /100 | #249 | Tragic 12.5% |
| Irish | 1.3 /100 | #250 | Tragic 12.5% |
| Aleuts | 1.3 /100 | #251 | Tragic 12.5% |
| Liberians | 0.9 /100 | #252 | Tragic 12.6% |
| Somalis | 0.9 /100 | #253 | Tragic 12.6% |
| Senegalese | 0.8 /100 | #254 | Tragic 12.6% |
| Welsh | 0.7 /100 | #255 | Tragic 12.6% |
| Immigrants | Colombia | 0.6 /100 | #256 | Tragic 12.6% |
| Immigrants | Somalia | 0.6 /100 | #257 | Tragic 12.6% |
| Indonesians | 0.6 /100 | #258 | Tragic 12.6% |
| Yuman | 0.6 /100 | #259 | Tragic 12.6% |
| Immigrants | Uruguay | 0.6 /100 | #260 | Tragic 12.6% |
| Immigrants | Dominica | 0.5 /100 | #261 | Tragic 12.6% |
Demographics Similar to Immigrants from Denmark by Divorced or Separated
In terms of divorced or separated, the demographic groups most similar to Immigrants from Denmark are Arab (11.6%, a difference of 0.0%), Immigrants from Fiji (11.6%, a difference of 0.010%), Spanish American Indian (11.6%, a difference of 0.060%), Zimbabwean (11.6%, a difference of 0.10%), and Immigrants from Serbia (11.6%, a difference of 0.11%).
| Demographics | Rating | Rank | Divorced or Separated |
| Immigrants | Albania | 99.3 /100 | #85 | Exceptional 11.5% |
| Immigrants | Latvia | 99.2 /100 | #86 | Exceptional 11.6% |
| Immigrants | Nepal | 99.2 /100 | #87 | Exceptional 11.6% |
| Immigrants | Europe | 99.2 /100 | #88 | Exceptional 11.6% |
| Immigrants | Southern Europe | 99.1 /100 | #89 | Exceptional 11.6% |
| Zimbabweans | 99.0 /100 | #90 | Exceptional 11.6% |
| Spanish American Indians | 99.0 /100 | #91 | Exceptional 11.6% |
| Immigrants | Denmark | 98.9 /100 | #92 | Exceptional 11.6% |
| Arabs | 98.9 /100 | #93 | Exceptional 11.6% |
| Immigrants | Fiji | 98.9 /100 | #94 | Exceptional 11.6% |
| Immigrants | Serbia | 98.8 /100 | #95 | Exceptional 11.6% |
| Immigrants | Ukraine | 98.7 /100 | #96 | Exceptional 11.6% |
| Latvians | 98.7 /100 | #97 | Exceptional 11.6% |
| Immigrants | Jordan | 98.6 /100 | #98 | Exceptional 11.6% |
| Immigrants | Sweden | 98.6 /100 | #99 | Exceptional 11.6% |