Tongan vs Immigrants from Denmark Divorced or Separated
COMPARE
Tongan
Immigrants from Denmark
Divorced or Separated
Divorced or Separated Comparison
Tongans
Immigrants from Denmark
11.1%
DIVORCED OR SEPARATED
100.0/ 100
METRIC RATING
32nd/ 347
METRIC RANK
11.6%
DIVORCED OR SEPARATED
98.9/ 100
METRIC RATING
92nd/ 347
METRIC RANK
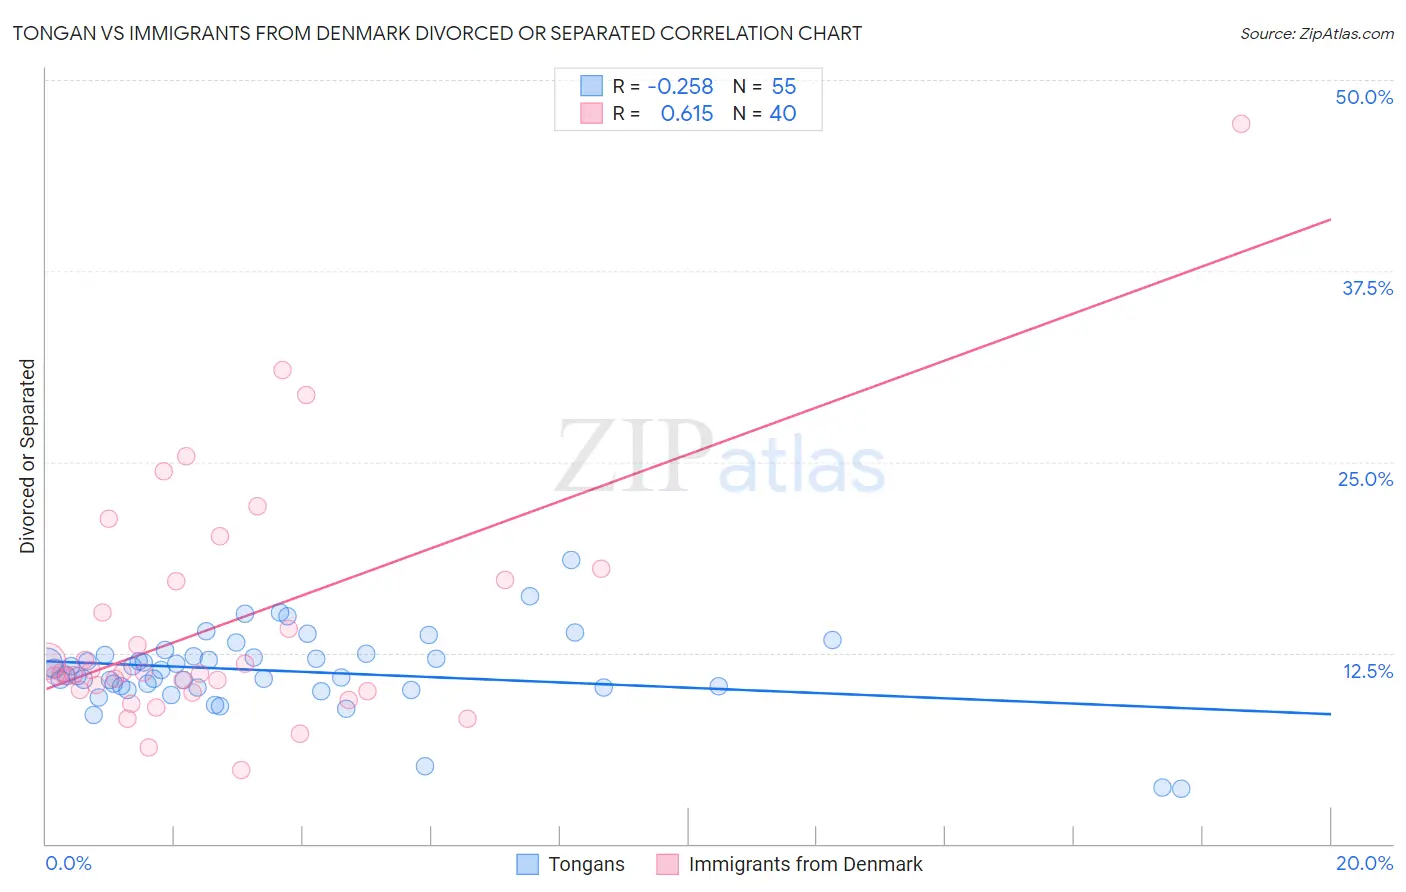
Tongan vs Immigrants from Denmark Divorced or Separated Correlation Chart
The statistical analysis conducted on geographies consisting of 102,897,047 people shows a weak negative correlation between the proportion of Tongans and percentage of population currently divorced or separated in the United States with a correlation coefficient (R) of -0.258 and weighted average of 11.1%. Similarly, the statistical analysis conducted on geographies consisting of 136,412,843 people shows a significant positive correlation between the proportion of Immigrants from Denmark and percentage of population currently divorced or separated in the United States with a correlation coefficient (R) of 0.615 and weighted average of 11.6%, a difference of 4.6%.
Divorced or Separated Correlation Summary
| Measurement | Tongan | Immigrants from Denmark |
| Minimum | 3.6% | 4.8% |
| Maximum | 18.6% | 47.1% |
| Range | 15.0% | 42.3% |
| Mean | 11.3% | 14.4% |
| Median | 11.4% | 11.2% |
| Interquartile 25% (IQ1) | 10.2% | 10.0% |
| Interquartile 75% (IQ3) | 12.4% | 17.2% |
| Interquartile Range (IQR) | 2.1% | 7.2% |
| Standard Deviation (Sample) | 2.6% | 8.1% |
| Standard Deviation (Population) | 2.6% | 8.0% |
Similar Demographics by Divorced or Separated
Demographics Similar to Tongans by Divorced or Separated
In terms of divorced or separated, the demographic groups most similar to Tongans are Egyptian (11.1%, a difference of 0.040%), Mongolian (11.1%, a difference of 0.080%), Immigrants from Uzbekistan (11.1%, a difference of 0.12%), Cambodian (11.1%, a difference of 0.20%), and Immigrants from Japan (11.1%, a difference of 0.25%).
| Demographics | Rating | Rank | Divorced or Separated |
| Iranians | 100.0 /100 | #25 | Exceptional 10.8% |
| Immigrants | Indonesia | 100.0 /100 | #26 | Exceptional 10.9% |
| Immigrants | Bangladesh | 100.0 /100 | #27 | Exceptional 11.0% |
| Immigrants | Malaysia | 100.0 /100 | #28 | Exceptional 11.0% |
| Armenians | 100.0 /100 | #29 | Exceptional 11.0% |
| Immigrants | Ireland | 100.0 /100 | #30 | Exceptional 11.0% |
| Mongolians | 100.0 /100 | #31 | Exceptional 11.1% |
| Tongans | 100.0 /100 | #32 | Exceptional 11.1% |
| Egyptians | 100.0 /100 | #33 | Exceptional 11.1% |
| Immigrants | Uzbekistan | 100.0 /100 | #34 | Exceptional 11.1% |
| Cambodians | 100.0 /100 | #35 | Exceptional 11.1% |
| Immigrants | Japan | 100.0 /100 | #36 | Exceptional 11.1% |
| Immigrants | Lebanon | 100.0 /100 | #37 | Exceptional 11.1% |
| Immigrants | Greece | 100.0 /100 | #38 | Exceptional 11.1% |
| Immigrants | Egypt | 100.0 /100 | #39 | Exceptional 11.1% |
Demographics Similar to Immigrants from Denmark by Divorced or Separated
In terms of divorced or separated, the demographic groups most similar to Immigrants from Denmark are Arab (11.6%, a difference of 0.0%), Immigrants from Fiji (11.6%, a difference of 0.010%), Spanish American Indian (11.6%, a difference of 0.060%), Zimbabwean (11.6%, a difference of 0.10%), and Immigrants from Serbia (11.6%, a difference of 0.11%).
| Demographics | Rating | Rank | Divorced or Separated |
| Immigrants | Albania | 99.3 /100 | #85 | Exceptional 11.5% |
| Immigrants | Latvia | 99.2 /100 | #86 | Exceptional 11.6% |
| Immigrants | Nepal | 99.2 /100 | #87 | Exceptional 11.6% |
| Immigrants | Europe | 99.2 /100 | #88 | Exceptional 11.6% |
| Immigrants | Southern Europe | 99.1 /100 | #89 | Exceptional 11.6% |
| Zimbabweans | 99.0 /100 | #90 | Exceptional 11.6% |
| Spanish American Indians | 99.0 /100 | #91 | Exceptional 11.6% |
| Immigrants | Denmark | 98.9 /100 | #92 | Exceptional 11.6% |
| Arabs | 98.9 /100 | #93 | Exceptional 11.6% |
| Immigrants | Fiji | 98.9 /100 | #94 | Exceptional 11.6% |
| Immigrants | Serbia | 98.8 /100 | #95 | Exceptional 11.6% |
| Immigrants | Ukraine | 98.7 /100 | #96 | Exceptional 11.6% |
| Latvians | 98.7 /100 | #97 | Exceptional 11.6% |
| Immigrants | Jordan | 98.6 /100 | #98 | Exceptional 11.6% |
| Immigrants | Sweden | 98.6 /100 | #99 | Exceptional 11.6% |